Tuesday was a Follow Through Day (FTD). Despite the fact that it gave inclinations of being a weak one that would probably fail, the market so far is doing well. In 2008 I showed that performance in the week after a FTD was often indicative ofwhether the attempted rally was likely to succeed or not. I took a fresh, and slightly different, look this weekend. Using the current expanded FTD list I looked at performance starting 3 days after the FTDs. If a rally succeeded or failed before the close of day 3 then it was not included in study. There were 34 instances that closed under the FTD close on day 3. Of those, 12 (35%) went on to successful rallies. There were 46 that closed above the FTD close on day 3 (like Friday). Of those, 27 (59%) went on to successful rallies. Not overwhelming odds, but at least notable, and perhaps worth some consideration.
Showing posts with label IBD Follow Through Day. Show all posts
Showing posts with label IBD Follow Through Day. Show all posts
Monday, June 18, 2012

Wednesday, June 13, 2012
FTDs on Moderate Volume
Total NYSE volume was down slightly but Nasdaq volume rose on Tuesday. Using the original 1% gain rules that we used to create our Follow Through Day (FTD) database, this meant Tuesday did see a FTD in the Nasdaq. But what happens when volume rises to trigger a FTD, but it is still light? This is one concept I looked at in last night’s subscriber letter. To answer this question I looked at all FTDs where volume came in below its 10ma.

The inclinations over the 1st few days here appear moderately bearish. The stat at the bottom is interesting, and suggests the rally attempts often fail when FTDs don’t come on strong volume. And for those that may be curious, the success rate rises to 56% when volume comes in above its 10ma.
Monday, June 4, 2012
A New Look At 3 Down Days After An FTD
Last June I showed a study that looked at times the SPX pulled back 3 consecutive days after a Follow Through Day (FTD). Johan pointed it out in the comments so I thought I should take a fresh look. I made an adjustment an re-ran the results. The adjustment was that the study last June was conducted using the list of FTDs from the original Follow Through Day study. Since then, all of the FTD studies I have conducted have used a more complete list. The difference is that the original list was as generous as possible in determining a failure. It required the market to close below its intraday correction low before being deemed a fail. The more complete list simply requires an intraday probe to a new low, and it doesn’t look at the close. If I use the newer list, rather than the original, then results would look like this:

Results still appear bullish, but the 2 additional trades are both losers (over the 3-day period). They occurred on 8/2/82 and 10/13/98. There is also 1 important factor to consider about Tuesday’s FTD. It has already failed. The market hit new lows on Friday. There have only been 3 other instances of FTDs that have failed so quickly. One was the 8/2/82 that was just added to the study. The others were 3/8/01 and 9/25/08 (neither of which were followed by 3 down days in a row and are not included in this study). I'm not sure that the fact that the rally has already failed will matter, but it does mean the market is in a different state. It is undergoing a selloff and no longer involved in a rally attempt. And just the fact that we are in a different state makes me cautious about this study.

Results still appear bullish, but the 2 additional trades are both losers (over the 3-day period). They occurred on 8/2/82 and 10/13/98. There is also 1 important factor to consider about Tuesday’s FTD. It has already failed. The market hit new lows on Friday. There have only been 3 other instances of FTDs that have failed so quickly. One was the 8/2/82 that was just added to the study. The others were 3/8/01 and 9/25/08 (neither of which were followed by 3 down days in a row and are not included in this study). I'm not sure that the fact that the rally has already failed will matter, but it does mean the market is in a different state. It is undergoing a selloff and no longer involved in a rally attempt. And just the fact that we are in a different state makes me cautious about this study.
Wednesday, May 30, 2012
FTD Arrives on Moderate Breadth
In the 8/24/11 blog I looked at the impact of breadth on Follow Through Days (FTD). To compare breadth across market regimes, instead of using absolute breadth readings I use relative breadth readings. The study below uses the 1-yr Up Issues % Rank. This reading compares breadth versus all other days for the last year. Despite the strong price action, Tuesday only ranked in the 84th percentile breadth-wise. All stats are updated.

As you can see, there is no discernible short-term impact from the FTD. The stat at the bottom is interesting, and suggests the bears may even have a slight intermediate-term edge when FTDs don’t include strong breadth participation. And for those that may be curious, the success rate rises to 52% when breadth comes in above the 95th percentile.

As you can see, there is no discernible short-term impact from the FTD. The stat at the bottom is interesting, and suggests the bears may even have a slight intermediate-term edge when FTDs don’t include strong breadth participation. And for those that may be curious, the success rate rises to 52% when breadth comes in above the 95th percentile.
Thursday, October 20, 2011
Why I Still Look At FTDs & What Happens When A 1% Drop Follows One
I received a note the other day from a reader who asked why I have so many studies related to Follow Through Days (FTD) on the blog. The reader mentioned that the edges often provided by FTDs are not as compelling as many of my other studies. But one man’s trash is another man’s treasure. And while FTDs may not work as advertised and accurately predict new stock market rallies, they do a very nice job of defining the environment. A FTD tells us the market has undergone a correction. It tells us the market has made a multi-day move off the bottom. And it tells us that strong volume and price action have come into the market. Enthusiasm is picking up.
We understand that the rally is only going to succeed about 40%-50% of the time based on the FTD, but we don’t need to know right away whether it is going to succeed or not to make good use of the information. While many of the past FTD studies on the blog and in the Subscriber Letter have focused on action on and around FTDs and what that might mean for the intermediate-term, it can also be useful to simply put the current day’s action in proper context so that we may better understand what that action may imply over the next few days and weeks. I use context in many other ways and people hardly notice anymore. Studies are always framed by where the market is. Is it above or below the 200ma? At a 20-day high? At a 20-day low? These are all helpful, but recent work has led me to believe that FTDs can be just as useful in defining context, if not more so. So I’ll continue to incorporate them and am optimistic that doing so may uncover some real gems. Anyway…we had a FTD Tuesday and then Wednesday the market sold off strongly. Strong enthusiasm has quickly turned. Let’s look at other instances and what has followed.

The number of trades is a bit low, but the early indications appear to strongly favor another day of selling. Two things really strike me here. 1) There hasn’t been an instance in over 10 years. 2) Run-up/drawdown is heavily skewed in favor of the bears. Overall I find these results compelling enough to take under consideration.
We understand that the rally is only going to succeed about 40%-50% of the time based on the FTD, but we don’t need to know right away whether it is going to succeed or not to make good use of the information. While many of the past FTD studies on the blog and in the Subscriber Letter have focused on action on and around FTDs and what that might mean for the intermediate-term, it can also be useful to simply put the current day’s action in proper context so that we may better understand what that action may imply over the next few days and weeks. I use context in many other ways and people hardly notice anymore. Studies are always framed by where the market is. Is it above or below the 200ma? At a 20-day high? At a 20-day low? These are all helpful, but recent work has led me to believe that FTDs can be just as useful in defining context, if not more so. So I’ll continue to incorporate them and am optimistic that doing so may uncover some real gems. Anyway…we had a FTD Tuesday and then Wednesday the market sold off strongly. Strong enthusiasm has quickly turned. Let’s look at other instances and what has followed.

The number of trades is a bit low, but the early indications appear to strongly favor another day of selling. Two things really strike me here. 1) There hasn’t been an instance in over 10 years. 2) Run-up/drawdown is heavily skewed in favor of the bears. Overall I find these results compelling enough to take under consideration.
Wednesday, October 19, 2011
When FTDs Occur In Conjunction With 20-Day Highs
I discussed the other day that there has never been a Follow Through Day (FTD) that occurred AFTER a new 50-day high. There has also never been a FTD that occurred in conjunction with a new 50-day high. These things changed on Tuesday since the move up was also accompanied by an increase in volume. But there have been some FTDs that occurred in conjunction with 20-day highs. Below is a new study that shows how they fared.

Results here are impressive over both the short and intermediate-term. To get a better feel for the short-term returns I have listed the instances below.

The run-up to drawdown ratio here is quite impressive. I’ll also note that 7 of the 10 instances went on to have “successful” rallies. (“Success” means it either hit a new 200-day high or at least rose 2x as much as it had already risen off the bottom.) The 3 instances whose rallies did not succeed (circled in red) all saw run-ups of at least 2% before they eventually rolled over and made new lows.
More information on FTDs may be found here.
Positive aspects to this one include the strong breadth and the fact that it came after day 10.
Some obstacles to success include the fact that it is occurring under the 200ma and it is occurring after a substantial market decline.

Results here are impressive over both the short and intermediate-term. To get a better feel for the short-term returns I have listed the instances below.

The run-up to drawdown ratio here is quite impressive. I’ll also note that 7 of the 10 instances went on to have “successful” rallies. (“Success” means it either hit a new 200-day high or at least rose 2x as much as it had already risen off the bottom.) The 3 instances whose rallies did not succeed (circled in red) all saw run-ups of at least 2% before they eventually rolled over and made new lows.
More information on FTDs may be found here.
Positive aspects to this one include the strong breadth and the fact that it came after day 10.
Some obstacles to success include the fact that it is occurring under the 200ma and it is occurring after a substantial market decline.
Monday, October 17, 2011
This is the 1st Time SPX Has Rallied to a 50-day High Without One of These
One of the more amazing things I’ve noticed about the rally over the last 2 weeks is that it has come without any 1% Follow Through Day (FTD) on rising volume. Investors’ Business Daily first published and popularized the concept of the Follow Through Day (FTD). Though they have changed the definition slightly over the years, I have found their original definition to be useful in several studies. My tests go back to 1971, which was the inception of the Nasdaq, and also as far as some of my volume data goes. Since that time there has never been a rally that has taken the SPX from a drawdown of at least 8% to a new 50-day high that was not inclusive of a FTD – until Friday.
This puts this rally in uncharted territory, which is always a little bit of an uncomfortable place for me. A FTD could still occur, and just because we have had a strong 9-day rally does not mean a bull market has already been missed. But one purpose of the FTD concept is to help in identifying market bottoms. If we are already at a 50-day high, then I would say this is one case where the FTD has let traders down in try to identify that bottom.
Note: There was a 1% FTD in the Russell 2000 last week. I do not look at the Russell 2000 for FTD purposes. My studies have always looked at the Dow, Nasdaq, and SPX. The Nasdaq goes back to 1971, and I wanted to be sure to include that index initially. The Russell only has history back to the mid-80s. I feel consistency is important when testing and therefore I only look at those 3. IBD and others may sometimes look at additional indices. For consistency in testing, I don't. And this is the 1st rally where none of those 3 have registered the FTD before hitting a 50-day high.
This puts this rally in uncharted territory, which is always a little bit of an uncomfortable place for me. A FTD could still occur, and just because we have had a strong 9-day rally does not mean a bull market has already been missed. But one purpose of the FTD concept is to help in identifying market bottoms. If we are already at a 50-day high, then I would say this is one case where the FTD has let traders down in try to identify that bottom.
Note: There was a 1% FTD in the Russell 2000 last week. I do not look at the Russell 2000 for FTD purposes. My studies have always looked at the Dow, Nasdaq, and SPX. The Nasdaq goes back to 1971, and I wanted to be sure to include that index initially. The Russell only has history back to the mid-80s. I feel consistency is important when testing and therefore I only look at those 3. IBD and others may sometimes look at additional indices. For consistency in testing, I don't. And this is the 1st rally where none of those 3 have registered the FTD before hitting a 50-day high.
Wednesday, August 24, 2011
Short-term Implications of Breadth on a Follow Through Day
The strong move higher on increased volume meant that Tuesday was a Follow Through Day (FTD). FTDs are a concept that was created by William O’Neil, founder of Investors’ Business Daily. I have written about them extensively on the blog. In June for the 1st time I showed that FTD’s have a better chance of success when they are also accompanied by strong breadth. Tonight I also examined the short-term implications to FTDs with strong breadth vs. FTDs without. This first study below looks at performance following FTDs that came along with an Up Issue % reading that was among the top 5% of all readings over the previous year.

As you can see there appears to be an tendency for the market to continue higher after these strong-breadth FTDs. Now let’s examine performance after FTDs on days that did not show exceptional breadth strength.

Here there appears to be no edge or short-term upside inclination whatsoever. With Tuesday’s FTD coming on breadth that put it in the top 2% of all days for the last year the short-term outlook appears better.

As you can see there appears to be an tendency for the market to continue higher after these strong-breadth FTDs. Now let’s examine performance after FTDs on days that did not show exceptional breadth strength.

Here there appears to be no edge or short-term upside inclination whatsoever. With Tuesday’s FTD coming on breadth that put it in the top 2% of all days for the last year the short-term outlook appears better.
Monday, June 27, 2011
When Follow-Through Days are Followed by 3 Down Days
After posting a Follow-Through Day (FTD) on Tuesday, the market has now pulled back for 3 days in a row. Using the database of Follow-Through days from the original FTD study, I took a close look at short-term performance after other such post-FTD pullbacks. Of the 74 previous FTDs identified using the standard parameters from the original FTD study, 11 were immediately followed by three down days. Results following those instances can be found below.
![]()
We see here some extremely positive stats and what appears to be a strong inclination for an immediate move higher. I'll also note though, that only 3 of these 11 instances resulted in successful intermediate-term rallies from the FTD of 3 days prior.

We see here some extremely positive stats and what appears to be a strong inclination for an immediate move higher. I'll also note though, that only 3 of these 11 instances resulted in successful intermediate-term rallies from the FTD of 3 days prior.
Wednesday, June 22, 2011
The Impact of Breadth on Follow-Through Day Effectiveness
The higher volume and the strong gains on the 4th day of an attempted rally means Tuesday qualified as a Follow-Through Day (FTD) under the Investors Business Daily rules. Most striking to me was not the price gains or the volume but the exceptionally strong breadth on Tuesday. I ran several tests that examined how strong breadth on a FTD might affect its chances of success.
Before I show some of those tests I thought I would point you to the rules of FTDs and some of the assumptions I used in testing them. I basically followed all of the rules as IBD laid them out. Two rules that IBD has never clearly defined are what entails “success” or “failure”. I defined “failure” to be a close below the intraday low of the bottom prior to the FTD. I defined “success” as a move either 1) twice as large as the distance from the low of the potential bottom to the close of the FTD, or 2) a new 52-week high. More detailed explanations of the rules may be found using the link below:
http://quantifiableedges.blogspot.com/2008/01/ibd-follow-through-days-pt-1-are-they.html
Whether a FTD successfully predicts a rally is not an indication of whether someone trading individual stocks using IBD’s techniques would make money or not. What it does measure is the usefulness of FTDs as a market timing indicator. I believe this is a fair way to test them since IBD claims they are valuable in identifying when downtrends are ending and new uptrends are emerging.
Using the original parameters as described in the post I linked to above there have been 74 FTDs since 1971. Thirty-eight of them (53%) led to successful rallies. This is an interesting stat but it doesn’t tell the whole story. Below is an equity curve that I don’t believe I’ve ever shown prior to last night's subscriber letter. It shows how someone trading the SPX would have performed using FTDs as a buy trigger and then exiting the trade when the rally either “succeeded” or “failed”.
![]()
As you can see FTDs worked very well during the long bull market of the 80s and 90s. But in the 70s, and again since 2000, FTDs have struggled as a market timing tool.
As I mentioned earlier, breadth was also very strong on Tuesday. When compared to the past year the Up Issues % on the NYSE was higher than 98.4% of all days. I used the Up Issues % Rank to normalize breadth over the long test period, and broke down FTD results based on those times the 1-yr % Rank was > 95% and those times it was < 95%. First let’s look at times like now where the NYSE Up Issues % Rank was > 95%. (An Up Issues % Rank > 95% means that a higher % of issues traded up today than in 95% of all days over the past year.)
![]()
In this case 22 of 35 FTDs (63%) have been followed by successful rallies and gains have been fairly steady over the years.
Now let’s look at FTDs that came without very strong relative breadth.
![]()
Results here were never strong and they’ve turned quite negative in recent years. Rather than a 63% success rate as happened with strong breadth, only 44% of instances here succeeded.
So for those who may not have considered it in the past, examining breadth strength on FTDs seems a worthwhile endeavor.
Before I show some of those tests I thought I would point you to the rules of FTDs and some of the assumptions I used in testing them. I basically followed all of the rules as IBD laid them out. Two rules that IBD has never clearly defined are what entails “success” or “failure”. I defined “failure” to be a close below the intraday low of the bottom prior to the FTD. I defined “success” as a move either 1) twice as large as the distance from the low of the potential bottom to the close of the FTD, or 2) a new 52-week high. More detailed explanations of the rules may be found using the link below:
http://quantifiableedges.blogspot.com/2008/01/ibd-follow-through-days-pt-1-are-they.html
Whether a FTD successfully predicts a rally is not an indication of whether someone trading individual stocks using IBD’s techniques would make money or not. What it does measure is the usefulness of FTDs as a market timing indicator. I believe this is a fair way to test them since IBD claims they are valuable in identifying when downtrends are ending and new uptrends are emerging.
Using the original parameters as described in the post I linked to above there have been 74 FTDs since 1971. Thirty-eight of them (53%) led to successful rallies. This is an interesting stat but it doesn’t tell the whole story. Below is an equity curve that I don’t believe I’ve ever shown prior to last night's subscriber letter. It shows how someone trading the SPX would have performed using FTDs as a buy trigger and then exiting the trade when the rally either “succeeded” or “failed”.
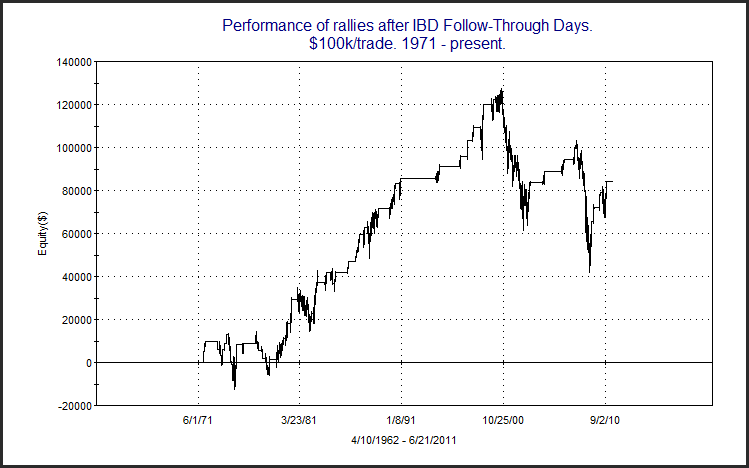
As you can see FTDs worked very well during the long bull market of the 80s and 90s. But in the 70s, and again since 2000, FTDs have struggled as a market timing tool.
As I mentioned earlier, breadth was also very strong on Tuesday. When compared to the past year the Up Issues % on the NYSE was higher than 98.4% of all days. I used the Up Issues % Rank to normalize breadth over the long test period, and broke down FTD results based on those times the 1-yr % Rank was > 95% and those times it was < 95%. First let’s look at times like now where the NYSE Up Issues % Rank was > 95%. (An Up Issues % Rank > 95% means that a higher % of issues traded up today than in 95% of all days over the past year.)
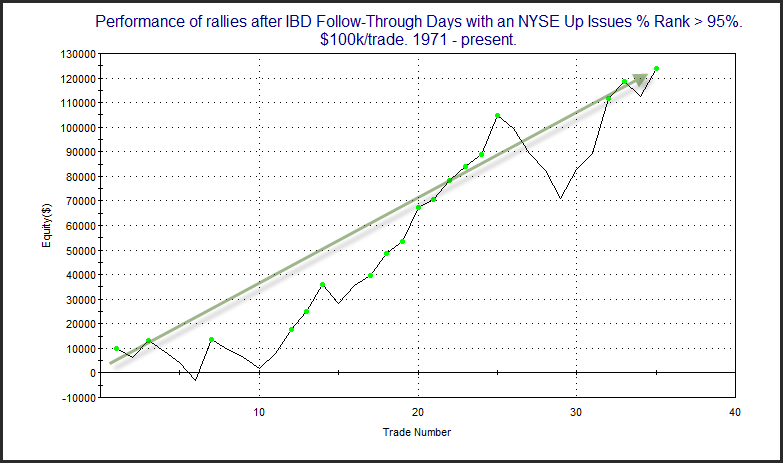
In this case 22 of 35 FTDs (63%) have been followed by successful rallies and gains have been fairly steady over the years.
Now let’s look at FTDs that came without very strong relative breadth.

Results here were never strong and they’ve turned quite negative in recent years. Rather than a 63% success rate as happened with strong breadth, only 44% of instances here succeeded.
So for those who may not have considered it in the past, examining breadth strength on FTDs seems a worthwhile endeavor.
Monday, July 12, 2010
Follow Through Days Before The 4th Day
It was pointed out to me that IBD declared Wednesday to be a Follow-Through-Day. Since it was only the 2nd day off the bottom this seemed odd to me. I’ve done an extensive series quantifying Follow-Through-Days. IBD’s rules have been fluid over time and sometimes nonsensical based on the evidence. From all appearances they have done very little actual research on their own indicator, and have never shared any verifiable results.
One basic guideline IBD has suggested with Follow-Through-Days is that they should occur between the 4th and 10th day of the beginning of a rally. I examined FTD’s after the 10th day in the February 29, 2008 blog post. At that time I found that FTD’s after day 10 are NOT less reliable as IBD claims. In fact, the small sample was much more reliable.
But what of FTD’s that occur prior to Day 4?
Using the original basic assumptions from the January 14, 2008 study I adjusted the requirement from 4 days (standard) to 2 days (Wednesday’s “FTD”). Below is a quick comparison since 1970. Again, refer to the original basic assumptions for definitions of success and failure of a FTD.
4th Day of Rally Is Earliest Possible FTD – 38 winners and 35 losers.
2nd Day of Rally Is Earliest Possible FTD – 39 winners and 43 losers.
So it appears that allowing FTD’s on day two did identify one additional rally. I looked to see when this additional “success” took place. It was July of 1973. The total rally only lasted 3 weeks. The reason it was “successful” if you entered on the FTD on the 2nd day off the bottom was that the “success” target of a move of twice the size of the distance from the bottom to the FTD was more easily achieved. This “successful” July rally never even went on to break the swing highs of May. Not exactly the kind of winner most traders would be disappointed to miss out on. And while it met the test definition, when looking at a chart it likely isn’t a rally that most traders would even consider successful. Also note that shortening the requirement to 2 days from 4 days triggers 8 more losers.
I don’t agree with many of IBD’s teachings on FTD’s, but in my eyes this particular rule (waiting until day 4) is a very good one. I personally wouldn’t ignore it and am a bit surprised that they did.
One basic guideline IBD has suggested with Follow-Through-Days is that they should occur between the 4th and 10th day of the beginning of a rally. I examined FTD’s after the 10th day in the February 29, 2008 blog post. At that time I found that FTD’s after day 10 are NOT less reliable as IBD claims. In fact, the small sample was much more reliable.
But what of FTD’s that occur prior to Day 4?
Using the original basic assumptions from the January 14, 2008 study I adjusted the requirement from 4 days (standard) to 2 days (Wednesday’s “FTD”). Below is a quick comparison since 1970. Again, refer to the original basic assumptions for definitions of success and failure of a FTD.
4th Day of Rally Is Earliest Possible FTD – 38 winners and 35 losers.
2nd Day of Rally Is Earliest Possible FTD – 39 winners and 43 losers.
So it appears that allowing FTD’s on day two did identify one additional rally. I looked to see when this additional “success” took place. It was July of 1973. The total rally only lasted 3 weeks. The reason it was “successful” if you entered on the FTD on the 2nd day off the bottom was that the “success” target of a move of twice the size of the distance from the bottom to the FTD was more easily achieved. This “successful” July rally never even went on to break the swing highs of May. Not exactly the kind of winner most traders would be disappointed to miss out on. And while it met the test definition, when looking at a chart it likely isn’t a rally that most traders would even consider successful. Also note that shortening the requirement to 2 days from 4 days triggers 8 more losers.
I don’t agree with many of IBD’s teachings on FTD’s, but in my eyes this particular rule (waiting until day 4) is a very good one. I personally wouldn’t ignore it and am a bit surprised that they did.
Tuesday, February 16, 2010
Follow Through Days Above vs. Below the 200ma
I discussed on Friday that Thursday’s action qualified as a follow through day (FTD) under Investors Business Daily’s classic definition in which a higher volume rise of 1% or more in one of the major indices is required. Apparently IBD didn’t count it since it didn’t quite meet their new 1.7% rise definition. I’m not a big fan of the new rule and believe the 1% requirement is more useful that the new 1.7%. For details on why I feel this way you may refer to this old blog post on the subject:
http://quantifiableedges.blogspot.com/2008/01/follow-through-days-pt-2-does-every.html
I thought it might be interesting to examine a few new ideas with regards to FTD’s today. Before I do that I’ll first point you to the post where I defined the rules of the tests. I basically followed all of the rules as IBD laid them out. Two rules that IBD has never clearly defined are what entails “success” or “failure”. I defined “failure” to be a close below the intraday low of the bottom prior to the FTD. I defined “success” as a move either 1) twice a large as the distance from the low of the potential bottom to the close of the FTD, or 2) a new 52-week high. More detailed explanations of the rules may be found using the link below:
http://quantifiableedges.blogspot.com/2008/01/ibd-follow-through-days-pt-1-are-they.html
Under these rules, and requiring an 8% pullback before looking for a FTD, there have now been 71 FTD’s since 1971. 37 have been “successes” and 34 have been “failures” for a winning % of 52%. One of the findings I published during the 2008 series on FTDs was that FTD’s coming after smaller pullback had a better success rate than FTD’s coming after larger pullbacks. It was this research that led me to ponder whether this FTD may have a better chance of success because the rally attempt is occurring while the SPX is above its 200ma. It would seem to make sense that there might be a better chance of success since the long-term uptrend has not clearly turned down at this point.
What I found when examining the 71 follow through days that now qualify based on the original study was that only 23 closed above the 200ma. Of those 23, 14 turned out to be winners and 9 losers. This 61% success rate is better than the 48% success rate that has occurred below the 200ma with 23 winners and 25 losers. It isn’t overwhelmingly better, though. I’m not sure the distinction is worth making.
http://quantifiableedges.blogspot.com/2008/01/follow-through-days-pt-2-does-every.html
I thought it might be interesting to examine a few new ideas with regards to FTD’s today. Before I do that I’ll first point you to the post where I defined the rules of the tests. I basically followed all of the rules as IBD laid them out. Two rules that IBD has never clearly defined are what entails “success” or “failure”. I defined “failure” to be a close below the intraday low of the bottom prior to the FTD. I defined “success” as a move either 1) twice a large as the distance from the low of the potential bottom to the close of the FTD, or 2) a new 52-week high. More detailed explanations of the rules may be found using the link below:
http://quantifiableedges.blogspot.com/2008/01/ibd-follow-through-days-pt-1-are-they.html
Under these rules, and requiring an 8% pullback before looking for a FTD, there have now been 71 FTD’s since 1971. 37 have been “successes” and 34 have been “failures” for a winning % of 52%. One of the findings I published during the 2008 series on FTDs was that FTD’s coming after smaller pullback had a better success rate than FTD’s coming after larger pullbacks. It was this research that led me to ponder whether this FTD may have a better chance of success because the rally attempt is occurring while the SPX is above its 200ma. It would seem to make sense that there might be a better chance of success since the long-term uptrend has not clearly turned down at this point.
What I found when examining the 71 follow through days that now qualify based on the original study was that only 23 closed above the 200ma. Of those 23, 14 turned out to be winners and 9 losers. This 61% success rate is better than the 48% success rate that has occurred below the 200ma with 23 winners and 25 losers. It isn’t overwhelmingly better, though. I’m not sure the distinction is worth making.
Friday, February 12, 2010
Revisting Short-term Performance After FTD's
With the markets rising more than 1% on higher volume exactly 4 days after a potential bottom, Thursday can be labeled a Follow Through Day (FTD). As I mentioned last night I did an extensive study of FTD’s on the blog back in 2008. A summary page with links may be found here:
http://quantifiableedges.blogspot.com/2008/07/follow-through-days-quantified.html
Among the links found on that page, traders might be especially interested in the study of short-term implications from Feb 1, 2008. In that post I point out that while intermediate-term traders often view the FTD with bullish optimism, swing traders may see it as a short setup since the market is now “overbought in a downtrend”. We’ve seen many, many times before that overbought doesn’t necessarily mean a downside edge and oversold doesn’t’ necessarily mean an upside edge. This is why two lines are incorporated in the Aggregator and why confirmation is needed with both lines before a position is taken. So below I’ve updated the stats showing SPX performance in the days following a FTD.

Results are solidly, though not overwhelmingly, bullish. In any case the edge appears to be to the upside and it is certainly an environment that you typically want to be cautious if trying to short.
http://quantifiableedges.blogspot.com/2008/07/follow-through-days-quantified.html
Among the links found on that page, traders might be especially interested in the study of short-term implications from Feb 1, 2008. In that post I point out that while intermediate-term traders often view the FTD with bullish optimism, swing traders may see it as a short setup since the market is now “overbought in a downtrend”. We’ve seen many, many times before that overbought doesn’t necessarily mean a downside edge and oversold doesn’t’ necessarily mean an upside edge. This is why two lines are incorporated in the Aggregator and why confirmation is needed with both lines before a position is taken. So below I’ve updated the stats showing SPX performance in the days following a FTD.

Results are solidly, though not overwhelmingly, bullish. In any case the edge appears to be to the upside and it is certainly an environment that you typically want to be cautious if trying to short.
Monday, December 8, 2008
FTD's After the Crash of 1929
The market posted a Follow Through Day again last week. This is at least the 6th Follow-Through Day since the 2007 top. New blog readers may want to check out the series of studies I’ve written on Follow-Through Days (FTD’s) to gauge their usefulness.
There are some issues a trader would have if they used a FTD as a market buy signal. (This is not the recommended use by IBD, but does help to determine the predictive power of FTD’s when conducting studies.) One issue is that they tend to commonly fail during difficult bear markets.
Several weeks ago in the Subscriber Letter I posted a study which looked at FTD effectiveness following the Crash of ’29. (This study only looked at the Dow.) Below is an excerpt from that Letter:
I thought it would be interesting to see how FTD’s performed following the 1929 crash. As a brief reminder, “success” for a FTD would entail either 1) The market making a new high or 2) a rally from the close of the FTD that equals at least twice the distance from the low to the FTD. Below are charts spanning the period from 1929 to in 1932.

In this chart we see several failures and one FTD that led to a rally meeting its target. While it didn’t meet the definition of success, the rally in the early part of 1930 was actually the best over the time period.
Next is ’31 – ’32:

Plenty more failures are seen here before the market finally bottoms in mid-1932. All told there were 13 failed FTD’s and one successful one before the 1932 bottom arrived.
A FTD is a positive sign when looking for a potential market bottom and subsequent rally. The current rally attempt may succeed. The market certainly seems overdue for a substantial and sustained rally. FTD and other bottoming signals have proven far less reliable over the last year. There have been a few other times where they have struggled as well. The period above is one example. Just something for the back of the mind as the current rally attempt unfolds.
------------------------------------------------------------------------------------
There are some issues a trader would have if they used a FTD as a market buy signal. (This is not the recommended use by IBD, but does help to determine the predictive power of FTD’s when conducting studies.) One issue is that they tend to commonly fail during difficult bear markets.
Several weeks ago in the Subscriber Letter I posted a study which looked at FTD effectiveness following the Crash of ’29. (This study only looked at the Dow.) Below is an excerpt from that Letter:
I thought it would be interesting to see how FTD’s performed following the 1929 crash. As a brief reminder, “success” for a FTD would entail either 1) The market making a new high or 2) a rally from the close of the FTD that equals at least twice the distance from the low to the FTD. Below are charts spanning the period from 1929 to in 1932.

In this chart we see several failures and one FTD that led to a rally meeting its target. While it didn’t meet the definition of success, the rally in the early part of 1930 was actually the best over the time period.
Next is ’31 – ’32:

Plenty more failures are seen here before the market finally bottoms in mid-1932. All told there were 13 failed FTD’s and one successful one before the 1932 bottom arrived.
A FTD is a positive sign when looking for a potential market bottom and subsequent rally. The current rally attempt may succeed. The market certainly seems overdue for a substantial and sustained rally. FTD and other bottoming signals have proven far less reliable over the last year. There have been a few other times where they have struggled as well. The period above is one example. Just something for the back of the mind as the current rally attempt unfolds.
------------------------------------------------------------------------------------
Anyone who would like to purchase the FTD code for their own testing may do so here.
A note to blog readers: I will be out of action most of this week. There may not be any other posts until next week. Fear not. I shall return to the blogosphere next week with a vengeance. – Rob
A note to Gold & Silver Subscribers: I completed implementation of a new distribution system. I believe everything is working fine. If you did not receive tonight's Letter, please contact me ASAP.
Monday, July 21, 2008
Follow Through Days Quantified
Now that the market has bounced and a potential bottom has been established, CANSLIM and other intermediate-term traders are awaiting a Follow Through Day (FTD). Back in January and February I wrote a series on Follow Through Days and deconstructed them, showing actual statistics based on different assumptions and parameters. If you haven’t seen that series of posts and you trade in the intermediate-term time frame, I’d encourage you to check it out.
Below is a quick summary of my quantification of FTD’s:
1) While I’ve read claims of success rates as high as 80%, using extremely generous assumptions my studies showed success rates of about 55% since 1971.
2) Using the original 1% thrust higher requirement, every rally since 1971 would have been accompanied by a FTD. Increasing the requirement above 1% as IBD has suggested in recent years would have seen several substantial rallies occur without FTD’s
3) In most circumstances the FTD occurs close enough to the bottom for traders to be able to catch a substantial portion of a successful rally.
4) Market action in the days after a FTD has been a decent predictor of whether that FTD is likely to succeed.
5) Leadership may not emerge until some time after the FTD. Traders should not expect it to be present and obvious immediately.
6) FTD’s tend to be more reliable after small declines than large ones.
7) FTD’s after day 10 have had a higher success rate over the last 37 years than FTD’s that occurred between days 4-10. This is contrary to what is typically taught.
For those traders who use Tradestation and would like to conduct their own research, I have now released the Quantifiable Edges Follow Through Day Study on the website. It can be downloaded and tweaked as soon as you order. As with all the studies, the code is open and there are flexible inputs for further research. Here’s an example of how results may vary depending on your inputs:
In the original post which discussed success rates, the assumption I used to label a FTD a failure is that the S&P had to CLOSE below its downtrend low. I did this at the time because I wanted to make the inputs a generous as possible to try and reach the 70%-80% success rate that was claimed. Here’s a graph of the S&P 500 going back to December to see how this would have looked.

If I change the requirement from a CLOSE below the low to an intraday LOW below the low, the results change significantly. Now the success rate drops from 54% down to 45%. Most people might consider this an even more accurate representation. The chart with the adjustment to that input is shown below:

Below is a quick summary of my quantification of FTD’s:
1) While I’ve read claims of success rates as high as 80%, using extremely generous assumptions my studies showed success rates of about 55% since 1971.
2) Using the original 1% thrust higher requirement, every rally since 1971 would have been accompanied by a FTD. Increasing the requirement above 1% as IBD has suggested in recent years would have seen several substantial rallies occur without FTD’s
3) In most circumstances the FTD occurs close enough to the bottom for traders to be able to catch a substantial portion of a successful rally.
4) Market action in the days after a FTD has been a decent predictor of whether that FTD is likely to succeed.
5) Leadership may not emerge until some time after the FTD. Traders should not expect it to be present and obvious immediately.
6) FTD’s tend to be more reliable after small declines than large ones.
7) FTD’s after day 10 have had a higher success rate over the last 37 years than FTD’s that occurred between days 4-10. This is contrary to what is typically taught.
For those traders who use Tradestation and would like to conduct their own research, I have now released the Quantifiable Edges Follow Through Day Study on the website. It can be downloaded and tweaked as soon as you order. As with all the studies, the code is open and there are flexible inputs for further research. Here’s an example of how results may vary depending on your inputs:
In the original post which discussed success rates, the assumption I used to label a FTD a failure is that the S&P had to CLOSE below its downtrend low. I did this at the time because I wanted to make the inputs a generous as possible to try and reach the 70%-80% success rate that was claimed. Here’s a graph of the S&P 500 going back to December to see how this would have looked.

If I change the requirement from a CLOSE below the low to an intraday LOW below the low, the results change significantly. Now the success rate drops from 54% down to 45%. Most people might consider this an even more accurate representation. The chart with the adjustment to that input is shown below:

If you trade intermediate-term I’d recommend you learn all you can about this tool. Understand the true quantifiable value of Follow Though Days. Don’t just buy into the hype. Research it yourself. For those with Tradestation, the Quantifiable Edges Follow Through Day Study can be a great place to start.
Friday, February 29, 2008
Are IBD Follow Through Days After Day 10 Less Reliable?
One of the interesting claims that William O’Neil make about Follow Through Days is that they are less likely to work if they come more than 10 days from the potential market bottom. As part of the study on Follow through Days, I decided to test this. Those who missed the first several installments of this study may want to click on the “IBD Follow Through Day” label lower down on the right hand side of the page. This will be the 9th installment in the series.
Using the original basic assumptions of an 8% decline needed and a 1% up move on the Follow Through Day (as opposed to the current 1.7% requirement that I found to be less effective), I reviewed all FTD’s listed in the study.
A Follow Through Day actually occurring after day 10 was a fairly unusual occurrence. Downtrends and bottom formations typically carry significant volatility, so a strong, high-volume move off a low normally occurs before day 10.
Of the 65 FTD’s listed in the study, only 8 of them occurred on day 10 or later. They are listed below along with the FTD Day # and whether they were “successful” or not. (Success was defined in Part 1 - Are They Predictive?)

Seven of the eight FTD’s that came after day 10 were successful according the study. While the sample size may be too small to claim significance, there certainly seems to be no credence to the claim that FTD’s after Day 10 are LESS reliable. In fact, the opposite appears true. Seven out of eight seems especially impressive considering the fact that only 55% of the FTD's in the study were successful. I suspect one reason for this may be that the delayed FTD allows stocks more time to carve out proper basing formations before the market attempts to launch higher. In light of the facts, it seems a curious claim for IBD to make.
Using the original basic assumptions of an 8% decline needed and a 1% up move on the Follow Through Day (as opposed to the current 1.7% requirement that I found to be less effective), I reviewed all FTD’s listed in the study.
A Follow Through Day actually occurring after day 10 was a fairly unusual occurrence. Downtrends and bottom formations typically carry significant volatility, so a strong, high-volume move off a low normally occurs before day 10.
Of the 65 FTD’s listed in the study, only 8 of them occurred on day 10 or later. They are listed below along with the FTD Day # and whether they were “successful” or not. (Success was defined in Part 1 - Are They Predictive?)

Seven of the eight FTD’s that came after day 10 were successful according the study. While the sample size may be too small to claim significance, there certainly seems to be no credence to the claim that FTD’s after Day 10 are LESS reliable. In fact, the opposite appears true. Seven out of eight seems especially impressive considering the fact that only 55% of the FTD's in the study were successful. I suspect one reason for this may be that the delayed FTD allows stocks more time to carve out proper basing formations before the market attempts to launch higher. In light of the facts, it seems a curious claim for IBD to make.
The takeaway here is: next time a follow through day doesn’t come immediately, traders shouldn’t fret. The chance of success is likely higher.
Friday, February 15, 2008
Follow Through Days - Better After Small Or Large Declines?
As someone pointed out in the comments section today, Investors Business Daily finally declared a Follow Through Day (FTD) on Wednesday. Therefore, I thought I should post the next study in my series on Follow Through Days. When we first started I had planned on this being Part 4, but the study has evolved as the market moved in interesting ways. For those who missed the first several parts of the series, you may click here for the full shebang. This will be the 8th post on the subject. When I am finished I hope to have the most complete and accurate information available anywhere on Follow Through Days.
Today I will try and assert whether Follow Through Days are more reliable after small or large declines. As you may recall, in the standard test I set up initially, I chose a decline of 8% to be required before a FTD would be looked for. To my knowledge, how deep or long a decline must be before someone can begin looking for a FTD has never clearly been defined. In September of 2005 IBD suggested that FTD’s can be useful even after pullbacks as small as 5%. I decided to look at how FTD’s performed after pullbacks of varying degrees of market declines. Below are the results from December of 1971 through today. Success parameters are laid out exactly as they were in Part 1.
After a decline of 5% or more – 115 FTD’s, 63.5% successful.
After a decline of 8% or more – 64 FTD’s, 54.7% successful.**
After a decline of 10% or more – 48 FTD’s, 48% successful.
After a decline of 12% or more – 36 FTD’s, 44.4% successful.
Generally, the deeper the decline, the less likely it is that a FTD is going to be successful. It is reasonable that more serious selloffs have more difficulty reversing. It is a bit disappointing though that a tool which is billed to signal the end of a market decline seems to fair worse when it’s needed most.
** This was the base test looked at previously.
---------------------------------------------------------------------------------
Would you like detailed market analysis, CBI sector coverage and quantified actionable trade ideas from me several times per week? The Quantifiable Edges Subscriber Letter is coming next week! Just send your name and email address to QuantEdges@HannaCapital.com to receive the first week’s issues free of charge. More details should be available this weekend.
Today I will try and assert whether Follow Through Days are more reliable after small or large declines. As you may recall, in the standard test I set up initially, I chose a decline of 8% to be required before a FTD would be looked for. To my knowledge, how deep or long a decline must be before someone can begin looking for a FTD has never clearly been defined. In September of 2005 IBD suggested that FTD’s can be useful even after pullbacks as small as 5%. I decided to look at how FTD’s performed after pullbacks of varying degrees of market declines. Below are the results from December of 1971 through today. Success parameters are laid out exactly as they were in Part 1.
After a decline of 5% or more – 115 FTD’s, 63.5% successful.
After a decline of 8% or more – 64 FTD’s, 54.7% successful.**
After a decline of 10% or more – 48 FTD’s, 48% successful.
After a decline of 12% or more – 36 FTD’s, 44.4% successful.
Generally, the deeper the decline, the less likely it is that a FTD is going to be successful. It is reasonable that more serious selloffs have more difficulty reversing. It is a bit disappointing though that a tool which is billed to signal the end of a market decline seems to fair worse when it’s needed most.
** This was the base test looked at previously.
---------------------------------------------------------------------------------
Would you like detailed market analysis, CBI sector coverage and quantified actionable trade ideas from me several times per week? The Quantifiable Edges Subscriber Letter is coming next week! Just send your name and email address to QuantEdges@HannaCapital.com to receive the first week’s issues free of charge. More details should be available this weekend.
Thursday, February 7, 2008
Is Leadership Breadth Important For A Successful Bottom?
One reason cited by IBD recently for their lack of confidence in the current bottom attempt is the lack of stocks with sound basing formations. While doing a historical study of the number of basing formations seems near impossible to me, one reader suggested looking at new highs. I thought this was a good idea since it should give a reasonable estimate of leadership breadth.
I looked at every Follow Through Day (FTD) identified in Part 1 of the IBD Follow Through Day Study and calculated the percent of New York Stock Exchange stocks that hit new 52 week highs on the day of the FTD. I broke the results down into “Successful” and “Unsuccessful” FTD’s.
This is what I found:
The average percentage of NYSE stocks making new highs on “successful” FTD’s – 2.1%
The average percentage of NYSE stocks making new highs on “unsuccessful” FTD’s – 2.0%
The median percentage of NYSE stocks making new highs on “successful” FTD’s – 1.2%
The median percentage of NYSE stocks making new highs on “unsuccessful” FTD’s – 1.4%
The minimum percentage of NYSE stocks making new highs on “successful” FTD’s – 0.1%
The minimum percentage of NYSE stocks making new highs on “unsuccessful” FTD’s – 0.1%

It appears that leadership breadth has no predictive value when assessing the likelihood that a FTD will succeed or fail.
On January 31st there were 18 new highs out of 3272 issues traded on the NYSE according to my database. This equates to 0.55% and has hereby been deemed a useless fact.
I found the results somewhat surprising as I thought leadership breadth would provide at least some advantage.
I still feel leadership is important to sustain a rally. It appears many times the real bull leaders may not emerge immediately. While the FTD typically comes 4-10 days after the bottom, leadership may take 3 weeks or more to establish itself.
So will this rally attempt succeed? I don’t know. I do know if it fails it won’t be because leadership breadth was too weak.
After all this recent testing of "conventional market wisdom" I’m starting to feel like Adam and Jamie from the Discovery Channel. Myth: Leadership Breadth Is Important At Market Bottoms – BUSTED! Think I could land my own tv show?
I looked at every Follow Through Day (FTD) identified in Part 1 of the IBD Follow Through Day Study and calculated the percent of New York Stock Exchange stocks that hit new 52 week highs on the day of the FTD. I broke the results down into “Successful” and “Unsuccessful” FTD’s.
This is what I found:
The average percentage of NYSE stocks making new highs on “successful” FTD’s – 2.1%
The average percentage of NYSE stocks making new highs on “unsuccessful” FTD’s – 2.0%
The median percentage of NYSE stocks making new highs on “successful” FTD’s – 1.2%
The median percentage of NYSE stocks making new highs on “unsuccessful” FTD’s – 1.4%
The minimum percentage of NYSE stocks making new highs on “successful” FTD’s – 0.1%
The minimum percentage of NYSE stocks making new highs on “unsuccessful” FTD’s – 0.1%
It appears that leadership breadth has no predictive value when assessing the likelihood that a FTD will succeed or fail.
On January 31st there were 18 new highs out of 3272 issues traded on the NYSE according to my database. This equates to 0.55% and has hereby been deemed a useless fact.
I found the results somewhat surprising as I thought leadership breadth would provide at least some advantage.
I still feel leadership is important to sustain a rally. It appears many times the real bull leaders may not emerge immediately. While the FTD typically comes 4-10 days after the bottom, leadership may take 3 weeks or more to establish itself.
So will this rally attempt succeed? I don’t know. I do know if it fails it won’t be because leadership breadth was too weak.
After all this recent testing of "conventional market wisdom" I’m starting to feel like Adam and Jamie from the Discovery Channel. Myth: Leadership Breadth Is Important At Market Bottoms – BUSTED! Think I could land my own tv show?
Tuesday, February 5, 2008
I.B. Ranting
After persistently running higher for almost two weeks, the market finally began its pullback today. I am not a participant in the pullback, but rather an observer. While the overbought readings indicated there would likely be one soon, my studies indicated risk/reward was unfavorable in trying to short it.
As far as I’m concerned the action during this pullback becomes very important. I demonstrated last week that the first several days following a Follow Through Day are a pretty good predictor of success or failure. After 2 days we are still holding up. I’ll continue to monitor the action carefully.
Warning…rant coming…
One issue that has been raised is whether last Thursday was in fact a Follow Through Day. IBD apparently failed to label it one. In Friday’s Big Picture column they wrote:
“Given the market's volatility since late December, you'd need to see bigger gains than Thursday's to signal a fundamental shift in the market's trend.
As noted in Thursday's Big Picture, it's almost a moot point even if the market did manage to assemble a follow-through session of powerful gains in heavier volume. The reason? There are virtually no stocks close to proper buying positions right now.”
From my perspective, Thursday satisfied the requirements IBD previously laid out for Follow Through Days. Due to their perception of volatility and breadth they remain negative on the market's prospects. As they should, they are deriving their outlook from multiple readings of market health. Unfortunately it seems they would like to advertise the Follow Through Day as a magic indicator that never fails. Therefore, either they make excuses or change the definition of it so that it appears not to fail. Should this rally take hold I have no doubt they will refer to last Thursday as a Follow Through Day in a future publication. It is a tool that uses volume and price action. Breadth, while important, is a separate matter.
Whether Follow Through Days always work is not important to traders. What is important is whether they can be utilized as an effective tool for helping to identify market bottoms. So far we’ve seen that they have been about 55% accurate and risk outweighs reward. (part 1 and part 3) I’d say they have some utility. Constant refinement of the definition to retrofit recent market conditions destroys much of that utility in my eyes.
The McClellan Oscillator is a terrific tool for measuring the market’s health. Should the McClellans decide to constantly adjust the way it should be calculated, it would fail to be as useful.
The Follow Through Day study I laid out and have been discussing the last few weeks has identified Thursday as a Follow Through Day based on the original definition offered by William O’Neil. For purposes of my study and my trading it shall remain one whether it works or not.
…end of rant.
As far as I’m concerned the action during this pullback becomes very important. I demonstrated last week that the first several days following a Follow Through Day are a pretty good predictor of success or failure. After 2 days we are still holding up. I’ll continue to monitor the action carefully.
Warning…rant coming…
One issue that has been raised is whether last Thursday was in fact a Follow Through Day. IBD apparently failed to label it one. In Friday’s Big Picture column they wrote:
“Given the market's volatility since late December, you'd need to see bigger gains than Thursday's to signal a fundamental shift in the market's trend.
As noted in Thursday's Big Picture, it's almost a moot point even if the market did manage to assemble a follow-through session of powerful gains in heavier volume. The reason? There are virtually no stocks close to proper buying positions right now.”
From my perspective, Thursday satisfied the requirements IBD previously laid out for Follow Through Days. Due to their perception of volatility and breadth they remain negative on the market's prospects. As they should, they are deriving their outlook from multiple readings of market health. Unfortunately it seems they would like to advertise the Follow Through Day as a magic indicator that never fails. Therefore, either they make excuses or change the definition of it so that it appears not to fail. Should this rally take hold I have no doubt they will refer to last Thursday as a Follow Through Day in a future publication. It is a tool that uses volume and price action. Breadth, while important, is a separate matter.
Whether Follow Through Days always work is not important to traders. What is important is whether they can be utilized as an effective tool for helping to identify market bottoms. So far we’ve seen that they have been about 55% accurate and risk outweighs reward. (part 1 and part 3) I’d say they have some utility. Constant refinement of the definition to retrofit recent market conditions destroys much of that utility in my eyes.
The McClellan Oscillator is a terrific tool for measuring the market’s health. Should the McClellans decide to constantly adjust the way it should be calculated, it would fail to be as useful.
The Follow Through Day study I laid out and have been discussing the last few weeks has identified Thursday as a Follow Through Day based on the original definition offered by William O’Neil. For purposes of my study and my trading it shall remain one whether it works or not.
…end of rant.
Friday, February 1, 2008
Short-term Implications of Follow Through Days
Time for CANSLIM traders to go back to work. An IBD Follow Through Day triggered today. At Quantifiable Edges I’ve discussed the intermediate-term implications of Follow Through Days in great detail. Catch the entire series so far below:
While intermediate-term traders are rejoicing with today’s Follow Through Day, swing traders are noting how overbought the market has become on a short-term basis. Most of what I’ve read by short-term traders this afternoon and evening has been short-oriented. The prevailing theme is that we are now short-term overbought in a longer-term downtrend (or bear for some). Most people believe these are ideal conditions for shorting.
What swing traders looking to short need to understand is that nearly every Follow Through Day produces short-term overbought conditions in a downtrending market. They frequently arrive within 4-7 days of a bottom. Today was day 7 of the rally. As it was last week, most of the time the reversal off that bottom is violent. This can cause oscillators to become overbought. When the formula calls for a typically violent reversal, a week of gains, and a strong rally on high volume to cap it off – you’re bound to be overbought short-term. Does that mean it’s a good time to try a swing trade short?
To test it I looked at the 1-5 day returns of all 64 Follow Through Days listed in my study. $100,000 per trade. Go long on the close of the Follow Through Day. Exit X days later. Results below:

While intermediate-term traders are rejoicing with today’s Follow Through Day, swing traders are noting how overbought the market has become on a short-term basis. Most of what I’ve read by short-term traders this afternoon and evening has been short-oriented. The prevailing theme is that we are now short-term overbought in a longer-term downtrend (or bear for some). Most people believe these are ideal conditions for shorting.
What swing traders looking to short need to understand is that nearly every Follow Through Day produces short-term overbought conditions in a downtrending market. They frequently arrive within 4-7 days of a bottom. Today was day 7 of the rally. As it was last week, most of the time the reversal off that bottom is violent. This can cause oscillators to become overbought. When the formula calls for a typically violent reversal, a week of gains, and a strong rally on high volume to cap it off – you’re bound to be overbought short-term. Does that mean it’s a good time to try a swing trade short?
To test it I looked at the 1-5 day returns of all 64 Follow Through Days listed in my study. $100,000 per trade. Go long on the close of the Follow Through Day. Exit X days later. Results below:

More often than not the market trades higher over the next 1-5 days. The average win is larger than the average loss. Profits continue to be made on the long-side. Shorting is a losing game in this scenario. Perhaps this disbelief by short-term traders is what helps to continue to fuel the rally as they are constantly forced to cover their losing positions.
Is short-term success or failure indicative of long-term success or failure?
One interesting claim that IBD sometimes makes about Follow Through Days is that those that fail normally do so shortly after the Follow Through Day. I decided to also look at this concept tonight.
I broke the 64 Follow Through Days in my study up into two groups – the successful ones and the unsuccessful ones – to see if their early performance hinted at their chance of longer-term success. Below are the breakdowns – same as above - $100,000/trade, long at the close of the Follow Through Day, and exit X days later.
Early action after Follow Through Days that eventually “succeeded”:

Right off the bat most of these posted nice gains. The short-term winners among the group averaged another 2-3% upside in the first week. The short-term losers suffered 1-1.5% drops on average. Net profits were substantial.
Early action after Follow Through Days that eventually “failed”:

Those that eventually failed tended to show signs of failure right away. Notable here is the average loss was appreciably higher than the average gain.
A basic rule of thumb is that the success or failure was determined with about 67% reliability within the first week after a Follow Through Day. For instance, note there were 41 total trades that were in the black after 5 days. About 2/3 of them went on to “successful” rallies. The same ratio applies for the losers. There were 23 losers after 5 days. 15 of them ended up with “failed” rallies and the other 8 were “successful”. The 2/3 rule holds fairly accurate whether you are looking at winners or losers over any period from 1-5 days after the Follow Through Day. The Unemployment Report tomorrow morning has a chance to set the tone early on in this one.
To summarize the two main points tonight:
1) Don’t be too eager to short. It’s doesn’t have positive expected value just after a Follow Through Day.
2) Watch market action closely over the next week. It should give you a pretty good indication of the intermediate-term.
Is short-term success or failure indicative of long-term success or failure?
One interesting claim that IBD sometimes makes about Follow Through Days is that those that fail normally do so shortly after the Follow Through Day. I decided to also look at this concept tonight.
I broke the 64 Follow Through Days in my study up into two groups – the successful ones and the unsuccessful ones – to see if their early performance hinted at their chance of longer-term success. Below are the breakdowns – same as above - $100,000/trade, long at the close of the Follow Through Day, and exit X days later.
Early action after Follow Through Days that eventually “succeeded”:

Right off the bat most of these posted nice gains. The short-term winners among the group averaged another 2-3% upside in the first week. The short-term losers suffered 1-1.5% drops on average. Net profits were substantial.
Early action after Follow Through Days that eventually “failed”:

Those that eventually failed tended to show signs of failure right away. Notable here is the average loss was appreciably higher than the average gain.
A basic rule of thumb is that the success or failure was determined with about 67% reliability within the first week after a Follow Through Day. For instance, note there were 41 total trades that were in the black after 5 days. About 2/3 of them went on to “successful” rallies. The same ratio applies for the losers. There were 23 losers after 5 days. 15 of them ended up with “failed” rallies and the other 8 were “successful”. The 2/3 rule holds fairly accurate whether you are looking at winners or losers over any period from 1-5 days after the Follow Through Day. The Unemployment Report tomorrow morning has a chance to set the tone early on in this one.
To summarize the two main points tonight:
1) Don’t be too eager to short. It’s doesn’t have positive expected value just after a Follow Through Day.
2) Watch market action closely over the next week. It should give you a pretty good indication of the intermediate-term.
Subscribe to:
Posts (Atom)


