Friday, February 26, 2010

How The US Has Traded Since The January Highs When Europe Is Closed

Much of the time when the market has had bad days as of late people have pointed to troubles in Greece and Europe as the reason. I decided to isolate the US market a bit to see how much of the selling really could be attributed to Europe’s woes. The top pane of the chart shows closing half-hour readings for the SPY from the market top in the middle of January through Thursday’s close. The bottom pane shows an indicator that measures the movement of the US market from the time Europe is all closed at 11:30 EST until the NYSE closes at 4pm EST.


As you can see, while SPY is still down around 4% from its January highs, the 11:30 – 4:00 SPY broke out Thursday above the January highs.
I haven’t quantified what that may mean for the market moving forward but I’d love to hear others thoughts and interpretations...

Wednesday, February 24, 2010

This Former Study Is Suggesting QQQQ May Soon Bounce

In examining Tuesday’s action the Quantifinder spotted an interesting study from the 8/7/09 Blog that looks at QQQQ. I’ve updated the results below:


To me this appears to be a decent though not overwhelming edge that sees a good portion of the bullish tendency play out in the 1st two days.

Tuesday, February 23, 2010

A Look At The Recent Volatility Contraction

Over the last few days there has been a sharp contraction in volatility. In July I discussed an indicator that looks at the 3-day historical volatility and compares it to the historical volatility of the previous 10 days. When the ratio gets very low (below 0.25 in the study) it suggests a rapid expansion in volatility is likely.

I show this indicator each night on the charts page of the members area. I’ve pasted a copy of the chart below.


As you can see we have now spent two days in a row below 0.25. I’d expect to see a sharp move occur in the next few days.

Monday, February 22, 2010

This Study Suggests We're Headed Back To The Highs

It has now been 5 trading days since the 2/11 classic Follow Through Day (a gain of 1% or more on higher volume). In the February 1, 2008 blog post I examined implications of market action directly after FTD’s. In that post I found this early action to be a strong indication of whether a FTD was likely to succeed or not. A move higher in the SPX over the 1st 5 days after a FTD led to a successful rally about 2/3 of the time.

In the current situation “success” would be a move to 1,147.41 or higher. This is just barely under the January high of 1,150.45. In other words, based on this study, there appears to be a good chance the market will at least test its January highs before it breaks its February lows. One thing to note is that there still has not been a FTD under the current (1.7% gain) IBD definition, so it will be interesting to see what happens here.

Wednesday, February 17, 2010

Tuesday's Extremely Strong Breadth & Weak Volume

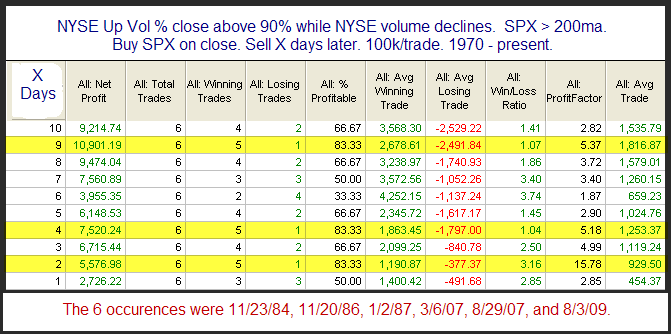
Tuesday was a 90% Up Volume day on the NYSE. At the same time volume declined from Friday’s levels and was below normal. It’s rare to see volume decline on a day when breadth is so overwhelmingly positive – especially when the market is in a long-term uptrend. Going back to 1970 I was only able to identify 6 other instances.


I’ve found many times that extreme breadth will often trump volume. Instances here are too few to draw any solid conclusions, but there is certainly no suggestion that the weak volume spells doom for the rally.

Tuesday, February 16, 2010

Follow Through Days Above vs. Below the 200ma

I discussed on Friday that Thursday’s action qualified as a follow through day (FTD) under Investors Business Daily’s classic definition in which a higher volume rise of 1% or more in one of the major indices is required. Apparently IBD didn’t count it since it didn’t quite meet their new 1.7% rise definition. I’m not a big fan of the new rule and believe the 1% requirement is more useful that the new 1.7%. For details on why I feel this way you may refer to this old blog post on the subject:

http://quantifiableedges.blogspot.com/2008/01/follow-through-days-pt-2-does-every.html

I thought it might be interesting to examine a few new ideas with regards to FTD’s today. Before I do that I’ll first point you to the post where I defined the rules of the tests. I basically followed all of the rules as IBD laid them out. Two rules that IBD has never clearly defined are what entails “success” or “failure”. I defined “failure” to be a close below the intraday low of the bottom prior to the FTD. I defined “success” as a move either 1) twice a large as the distance from the low of the potential bottom to the close of the FTD, or 2) a new 52-week high. More detailed explanations of the rules may be found using the link below:

http://quantifiableedges.blogspot.com/2008/01/ibd-follow-through-days-pt-1-are-they.html

Under these rules, and requiring an 8% pullback before looking for a FTD, there have now been 71 FTD’s since 1971. 37 have been “successes” and 34 have been “failures” for a winning % of 52%. One of the findings I published during the 2008 series on FTDs was that FTD’s coming after smaller pullback had a better success rate than FTD’s coming after larger pullbacks. It was this research that led me to ponder whether this FTD may have a better chance of success because the rally attempt is occurring while the SPX is above its 200ma. It would seem to make sense that there might be a better chance of success since the long-term uptrend has not clearly turned down at this point.

What I found when examining the 71 follow through days that now qualify based on the original study was that only 23 closed above the 200ma. Of those 23, 14 turned out to be winners and 9 losers. This 61% success rate is better than the 48% success rate that has occurred below the 200ma with 23 winners and 25 losers. It isn’t overwhelmingly better, though. I’m not sure the distinction is worth making.

Friday, February 12, 2010

Revisting Short-term Performance After FTD's

With the markets rising more than 1% on higher volume exactly 4 days after a potential bottom, Thursday can be labeled a Follow Through Day (FTD). As I mentioned last night I did an extensive study of FTD’s on the blog back in 2008. A summary page with links may be found here:

http://quantifiableedges.blogspot.com/2008/07/follow-through-days-quantified.html

Among the links found on that page, traders might be especially interested in the study of short-term implications from Feb 1, 2008. In that post I point out that while intermediate-term traders often view the FTD with bullish optimism, swing traders may see it as a short setup since the market is now “overbought in a downtrend”. We’ve seen many, many times before that overbought doesn’t necessarily mean a downside edge and oversold doesn’t’ necessarily mean an upside edge. This is why two lines are incorporated in the Aggregator and why confirmation is needed with both lines before a position is taken. So below I’ve updated the stats showing SPX performance in the days following a FTD.


Results are solidly, though not overwhelmingly, bullish. In any case the edge appears to be to the upside and it is certainly an environment that you typically want to be cautious if trying to short.

Thursday, February 11, 2010

A Follow Through Day Research Reminder

It’s now been a few days since we hit the lows. With a potential bottom in place IBD followers and some other intermediate-term traders are eagerly awaiting a Follow Through Day (FTD) signal to start putting money to work again. FTD’s get a lot of press but they are largely overrated as a predictive indicator and many reports on them from IBD and others are filled with lore rather than facts. Back in 2008 I did a series on FTD’s. I examined many claims about them and quantified them in detail. Traders who would like to learn more about FTD’s or who would like a refresher may want to check out that series starting with the overview at the link below:

http://quantifiableedges.blogspot.com/2008/07/follow-through-days-quantified.html

Monday, February 8, 2010

The Difference Between These Breadth Indicators Is Large And Bullish

Two useful breadth statistics that are tracked by Worden Bros. are the % of Stocks Trading Above the 200ma (T2107) and the % of Stocks Trading Above the 40ma (T2108). At the current time the difference between these two readings is very large. 72% of stocks remain above their 200ma, but only 24% stocks are above their 40ma. The only other time since 1986 when Worden Bros. began tracking these statistics that the difference has been this large was late October / early November of 2009. To get such a large difference between the readings you would need to have a strong pullback occur in a strong uptrend. I was curious to see whether such a strong pullback was likely to derail the long-term uptrend and lead to further selling. To get a better sense I lowered the required difference between the two to 40. Below are those results.


In general, returns were positive from day 1. From a long-term perspective, such sharp pullbacks have been followed by additional buying. Any uptrend strong enough that such a large number of stocks were trading above their 200ma that the difference could be as large as 40 simply didn’t fall apart when a strong selloff occurred. The 2004 instance saw a retest of the highs before the market underwent a lengthy but shallow selloff. The other instances all rallied through their old highs and kept rising. Instances are definitely low but results couldn’t be any more bullish.

While we are now way above a difference of 35, I also ran that to get a few more instances.


This seems to confirm the previous findings and suggests the current breadth differential is indicative of not a market about to fall apart, but rather a market that is likely to resume its uptrend – or at least test its recent highs.

Friday, February 5, 2010

Extremely Negative Breadth Days In A Long-Term Uptrend

I looked at yesterday’s selloff a number of different ways last night. The overriding theme suggested this selloff is already getting overdone. Below is one example of a study I ran.


Instances are low, but with 100% winners on days 2, 7, 8, and 9 as well as very strong average trade results over the period I felt it was worth considering.

Thursday, February 4, 2010

What A Very Weak Early TICK Has Led To In The Past

The market is off to a horrible start today. Back in November I looked at days that started off strong and did not register a negative TICK reading for the entire first half-hour. Strong starts often led to strong finishes. Today there were no positive TICK readings for the 1st half-hour. This kind of weakness happens quite rarely. When it has occurred in the past, it’s made for some very rough days. Below are statistics showing the 10am – 4pm EST performance after such weak starts.


Certainly not a knife you want to normally try and catch.

For those who would rather view it as a short-selling opportunity, here’s how it looks from the short side.


No matter how you view it, very weak starts like today tend to carry big risk and little reward for the bulls for the remainder of the day.

Wednesday, February 3, 2010

Low Volume Bounces Since July

Yesterday I showed a study that demonstrated how Monday’s low volume at the beginning of the bounce was in fact bullish, and not bearish. This is something that many people have difficulty believing. For the more visually inclined I’ve created a chart below that examines many of the moves up since July.

(click chart to enlarge)


Note that in basically every instance where the market was coming off a strong pullback, technicians could’ve complained about the volume. Volume can be a useful indicator, but it is constantly overvalued and misinterpreted. It’s certainly possible that this bounce could roll right over and substantial downmove could ensue. If it happens it isn’t because of the relatively low volume the last 2 days.

Tuesday, February 2, 2010

How Does Monday's Low Volume Affect The Bounce Chances?

NYSE volume came in at the lowest level in over 2 weeks as the market rallied on Monday. Conventional wisdom suggests this low volume is a bad sign and it hurts the chances for a further bounce/rally. I’ve seen many comments in the last 24 hours stating the bounce cannot be trusted because of the low volume. So below is one test I ran examining this theory.


I compared these stats to days when volume was not at a 10-day low and they are quite a bit better here. From this standpoint it doesn’t seem the low volume is any kind of a warning sign. In fact it appears this setup provides a bullish edge. Perhaps very weak volume leaves just enough doubters that they end up chasing the market higher over the next several days as they become more convinced.

Monday, February 1, 2010

4 Lower Lows Above The 200ma

The SPX has now made 4 lower lows. In the May 9, 2008 blog I showed a study that examined 4 lower lows. It broke it out above and below the 200ma. Updated results above the 200ma are below:


Results here are fairly bullish. This is just one of several studies I am following at the moment. The vast majority are suggesting a short-term upside edge. A word of caution that I’ve been discussing in the subscriber letter is that the market has been acting abnormally for the last 5-6 days. This increases risk and traders must decide how they want to handle it.