Saturday, December 29, 2012

The Incredible Story (In A Picture) of the Last Day of the Year


Last year in the 12/30/11 blog I showed that while the last day of the year used to be a bullish day for the market, that tendency has reversed this century. Below is an updated equity curve for the NASDAQ Composite on the last day of the year.


Closing up 29 years in a row is fairly astounding. Just as astounding is the abrupt end to the apparent edge.  I have no good explanation for why this may have changed, but it obviously has.

And that is something we always need to keep in mind. The market is constantly changing. It is important to always keep studying it, keep an open mind, and adapt as it evolves. Best to all in 2013! I hope it is a prosperous year for you and I hope Quantifiable Edges proves helpful along the way!

Thursday, December 27, 2012

What 100-day Highs In The VIX Could Imply For The Short-Term


The VIX is often referred to as the fear index.  When VIX levels are relatively high, that often suggests fear and uncertainty among market participants.  Relative highs can be measured a number of ways.  Often I will show VIX levels compared to short-term moving averages.  But an interesting study from yesterday's Quantifinder looked at 100-day VIX highs that occurred when the SPX was not making 100-day lows.  In other words, relatively extreme fear in a market that is not making long-term lows.  The study was last seen in the 3/16/11 Subscriber Letter (click here for a free trial). I have updated it below.


The stats seem to suggest a bullish edge that persists for at least three weeks. Much of that edge is realized over the first 1-7 days.

And not only has this setup been followed by bullish inclinations over the time frames shown here, but it has also been a compelling overnight setup.  For details on the overnight implications check out today’s post on Overnight Edges.

Lastly, I also noticed this morning that Woodshedder posted a study based on the short-term VIX action last night which also appears to suggest a bullish edge.

Friday, December 21, 2012

Twas 3 Nights Before Christmas (Again)


Thursday’s close marked the beginning of the next seasonally strong period.  The study below is the “Twas 3 Nights Before Christmas” study, and I have shown it each year on the blog.  Results are updated.


The stats all appear quite strong.  I would note the “Max Losing Trade” column shows very mild numbers from days 1-8, with no decline being worse than 2.5%.  Of course the fiscal cliff appears to be getting us off to a rough start this morning, and we could be in danger of the worst “Day 1” of the study…

Monday, December 17, 2012

The Most Wonderful Week Of The Year


Over several time horizons op-ex week in December has been the most bullish week of the year for the SPX.  The positive seasonality actually has persisted for up to 3 weeks.  I showed this last year in the 12/12/11 blog.  I’ve updated that study below to include last year’s stats.


Even though last year failed to see a move higher during opex week the stats still appear extremely strong.

Wednesday, December 12, 2012

An Updated Look At Intermediate-Term Highs Just Before A Fed Day


Today is a Fed Day. As I have discussed many times, Fed Days generally carry an upside tendency. But this tendency is greatly impacted by certain variables. A large collection of these variables may be found here on the blog under the “Fed Day”label. And many more may be found in the “Quantifiable Edges Guide to Fed Days”.

One variable I showed in September was whether the market was already at an intermediate-term high. Today I decided to updated that study.  This time I elected to show a stats table instead of the profit curve I showed in September.


No matter how you look at it, the intermediate-term high appears to take away the edge.

Thursday, December 6, 2012

1st 5 Day Low In Over 2 Weeks - QQQ Style


Yesterday I showed a SPY study that examined the 1st 5-day low in over 2 weeks. QQQ triggered its own version on Wednesday.  I showed the QQQ version last in the 11/12/10 subscriber letter.  There I found that the edge played out favorably below the 200ma but above it the edge was not apparent.  QQQ is below the 200ma, so here are the results from that 2010 study.


The numbers here appear very strong.

Wednesday, December 5, 2012

SPY's 1st 5-day Low In 2 Weeks - What That Implies


On Tuesday the SPY closed at a 5-day low for the 1st time in over 2 weeks.  This triggered the study below, which I have shown numerous times before in the subscriber letter.


Results here suggest a moderate upside edge.

Monday, December 3, 2012

What Friday's VIX Actions Hints At (Revisited)


Even with the SPX rising on Friday, the VIX managed to close up a bit. The VIX will typically trade in a direction opposite the SPX, so it is unusual that they both close higher. On Fridays, the VIX has a natural tendency to dip in the afternoon, so it is most unusual to see them both close higher on Friday. The study below was last seen a few months ago in 9/17/12 blog. It examines other instances of the VIX and SPX both closing higher on a Friday while the SPX is in an uptrending market. All stats are updated.


As you can see, there appears to be a decent downside edge suggested by this study. That edge primarily plays out over the first three days.

Monday, November 26, 2012

An Intermediate-Term Breadth Signal That Triggered on Friday


Friday was the 2nd 90% Up Volume day within 5 days.  In the past this has been a bullish indication for the intermediate-term.  Below is an updated results table from the 10/11/11 Subscriber Letter study that showed this.


While the market appears overdone short-term, the breadth thrust we saw last week appears to be a positive sign for the intermediate-term.

Wednesday, November 21, 2012

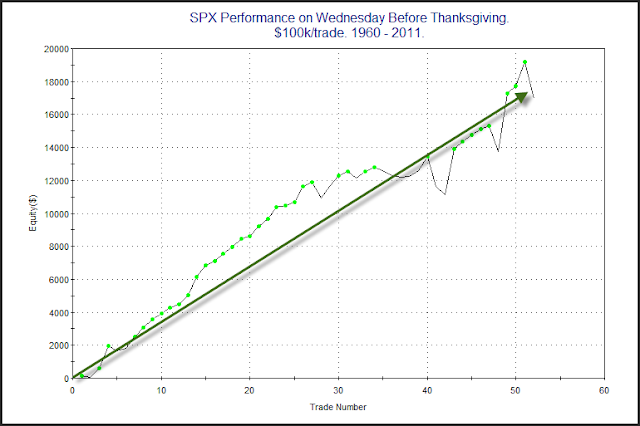
A Long-Term Look At Wednesday Before Thanksgiving

Thanksgiving has typically shown some pretty consistent seasonality.  Both the Wednesday before and the Friday after have exhibited bullish tendencies while the Monday after has been slightly bearish.  A couple of years ago I showed a table breaking it all down by day.  Today I decided to show a profit curve that represents simply owning the SPX from Tuesday's close through Wednesday's close.


Looks pretty good to me.  Happy Thanksgiving!

Monday, November 19, 2012

Intermediate-term Implications of the CBI Hitting 11 on Friday


I’ve written an awful lot about the Quantifiable Edges Capitulative Breadth Indicator (CBI) here on the blog.  The CBI moved up from 9 to 11 on Friday.  Many readers are aware that a reading of 10 or higher has been a strong short-term bullish signal over the years.  But I have not discussed intermediate-term implications of high readings before, except in the Subscriber Letter.  Below is a study from last night’s Letter with results of buying the SPX when the CBI reaches 11 or higher and then selling 20 days later.


As you can see, SPX has been a perfect 19-0 when looking out 20 days from the first CBI reading of 11+.  Drawdown stats are larger than most traders would prefer.  Still, it appears a reading of this magnitude often suggests a washout is in progress that should set the stage for at least a multi-week bounce.  We may not reach the “final” bottom here, but this study indicates we should see at least a temporary bottom form soon.

Wednesday, November 14, 2012

What the Recent String of Poor Closes Could Mean for Today


Where the market closes within its daily range can be an indicator of sentiment.  Over the years I have shown studies indicating persistent closes in one direction often lead to a reversion. An example of overly-optimistic closes was shown in the July 5, 2012 blog post. We are now seeing a setup suggesting excessive pessimism. Tuesday was the fifth day in a row that SPY closed in the lower half of its daily range. The study below was shown in the 12/20/11 subscriber letter (and again last night).  It examines 1-day returns following similar strings of poor closes.


The numbers here appear to be strongly compelling and indicate a possible upside edge for Wednesday.

Also, a reminder to readers that I will be speaking at the Las Vegas Traders Expo on Saturday.  In my talk I will be sharing a lot of my favorite overnight research.  I look forward to meeting several of you!

Tuesday, November 13, 2012

The Strongly Bearish Signal That (Barely) Triggered Monday


Bad breadth on an up day is something that has been shown to lead to bearish inclinations in the past.  On Monday, according to my data provider, the SPX closed up while the NYSE Up Volume % came in at 44.7%.  This triggered the below study, which I last showed way back on 3/31/10 in the Subscriber Letter.  I have updated the results.


As you can see the numbers are strongly bearish.  But there are some caveats to consider today.  SPX barely closed below its 200ma.  It also barely closed positive on Monday.  And the NYSE Up Volume % was only barely below 45%.  Therefore, while all of the criteria were met to trigger the study, the fact that they were just barley met suggests Monday's setup is not typical of the rest of the sample.  So the reaction may not be typical either.  Still, the fact that it did trigger suggests a move lower is possible and bulls should be on the alert.

Monday, November 12, 2012

A Long-Term Look At Veterans Day


Veterans Day is one of the few US holidays when the bond market is closed and the stock market is open. Columbus Day is another. But while Columbus Day has exhibited some quantifiable edges, Veterans Day has not.  (At least none that I have identified and feel confident about.)  Veterans Day is celebrated on November 11th (or the closest weekday to November 11th) each year. For a brief period from 1971 – 1977 it was celebrated on the 4th Monday of October. Below is a profit curve that shows how Veterans Day has performed over the years.


While for a good long while it appeared Veterans Day may provide an upside edge, the curve topped out in 1992. Since then it has been mostly lower. Happy Veterans Day and thanks to all veterans!

Tuesday, November 6, 2012

My New Interview With "Your Trading Edge" Magazine


Ben Power interviewed me for YTE magazine.  It just hit newsstands.  And it’s a cover story!  You can pick up a copy, or read it online.


How Has The Market Performed After Election Day?


Happy Election Day!  (Or is it Merry Election Day?)  Here is one view of how the SPX has fared following US elections from 1964 – 2008.


There is not a lot to glean from this.  But I would point out a couple of things.  1) Much of the negative total returns came thanks to the “Max Losing Trade”, which was 2008. 2) The “Max Winning Trade” over the next week is barely 3%.  So the election has not in years past served as a spark that led to a sharp rally.

Friday, November 2, 2012

Employment Days Just Ain't What They Used To Be


Employment days have an interesting history and they have contributed to some worthwhile studies over the years.  By “Employment Day” I mean days that the Federal Employment Report will be released.  This occurs once per month and is normally on the 1st Friday of the month. Below is a chart of SPY performance on Employment Days during bull market environments.  Each trade was a fictional $100k.


What I find so interesting about the chart is that for a long time Employment Days in uptrends showed a strong propensity for gains.  But in 2000 this edge vanished.  Since then there has been no apparent advantage – bullish or bearish.  While it’s unusual to see such an abrupt change in market dynamics, it does serve as a nice reminder that such changes are always possible.

Thursday, October 25, 2012

When Fed Days Close at Intermediate-Term Lows


In last night’s letter I examined 20-day lows that occur on Fed Days during long-term uptrends. The results appeared interesting. You'll find the stats table below.


Over the first 1-4 day period there doesn't appear to be much of an edge. But over the 5-10 day period the market has reliably risen. Instances are low, but I still thought the two-week results were strong enough to keep in mind and give some consideration.

Tuesday, October 23, 2012

Big Gaps Down the Day Before a Fed Day


The pre-market indications are for a gap down of about 1% as I write this around 8:20am EST.  With tomorrow being a Fed Day I decided to see how the market has performed other times it has seen large gaps down on the day prior to a Fed Day.  This first study looks at performance from open to close on the day of the gap down.


Note that the only instance that did NOT gap down at least 1% was the last one on 12/12/11.  Instances are low.  Initial returns are mixed with a mild bearish tilt.

Now let’s see what happens if we hold through the Fed Day.


Here we see a big turnaround.  All the 1% gaps down turned net positive from their opens.  And the only instance not to see a gain of greater than 1% on the Fed Day was the last one (which gapped down less than the others to start). It added to its day 1 losses.

Monday, October 22, 2012

How the Market has Historically Reacted to Very Bad Fridays


In the April 19, 2010 blog I showed a compelling study that examined large drops on Fridays.  Both the Crash of ’29 and the Crash of ’87 happened on Monday.  The Crash of ’87 is still remembered by many traders that are active today.  There was a strong selloff on Friday and then all hell broke loose on Monday.  But since then strong Friday selloffs have commonly been followed by bounces on Mondays.  Perhaps this is due to the fact that fear of a crash causes what might otherwise be an ordinary selloff to become exaggerated and overdone on Fridays.  Or perhaps it is just that people don’t want to hold over the weekend.  Whatever the reason, the tendency to bounce has been very strong.  I’ve updated that 4/19/10 study below.


The numbers here are all very impressive and suggest a strong bullish bias.

Monday, October 15, 2012

A Seasonal Look At October Op-Ex Monday


Opex week during October has typically been a strong week for the market.  This can be seen in our op-ex week breakdown by month from March.  And much of the upside edge has been thanks to the strong op-ex Monday returns.  But op-ex Monday in 2008 was SO unusually strong (11.5% 1-day gain) that I decided to run the numbers excluding it.  So here is a look at October op-ex Mondays since 1984 not including 2008.


As you can see the numbers are still very favorable.  There appears to be a bit of a bullish seasonal edge today.

Friday, October 12, 2012

A Bounce Study Suggesting More Downside


In an older study in the Subscriber Letter I looked at bounces after SPX is strongly short-term oversold as measured by RSI(2).  What I found in that letter was that lower-volume instances on the first day of the bounce have performed much better over the next few days than higher-volume bounces.  I won’t rehash the whole study here, but I will show performance following higher volume bounces like Thursday.


As you can see, it appears that such bounces suggest a short-term downside edge.

One reason the blog has been slow this week is that I am preparing for my trip to Atlanta next week to speak at the MTA meeting there.  If you’re in the Atlanta area and would like more info on my talk you may check out the link below.  You don’t need to be an MTA member to attend, but you should consider joining.

http://www.mta.org/eweb/dynamicpage.aspx?webcode=atlanta


Monday, October 8, 2012

A Columbus Day Edge Revisited


While the stock market is open on Monday, banks, schools, government offices, and the bond market are closed.  In past years with the bond market closed, the stock market has done quite well on Columbus Day.  Of course the most famous Columbus Day rally was in 2008 when the market gained over 11% after having crashed the week before.  Last year in the 10/10/11 blog I showed that positive momentum leading up to Columbus Day has generally led to a positive Columbus Day.  Columbus Day has been celebrated on the 2nd Monday of October since 1971.  Below is an updated version of last year’s study.


I’ve circled some of the more impressive stats here.  With 77% of trades profitable and winners twice the size of losers risk/reward has been very favorable.

Friday, October 5, 2012

Gaps Up to Short-Term (but not Intermediate-term) Highs on Employment Days

A positive reaction to the employment report has the market ready to gap up this morning.  Below is one way that I examined some odds for the day...


I wouldn't get too excited about this with the low sample size, but early indications appear to suggest a mild hint of a downside edge between now and the close.

Tuesday, October 2, 2012

What Yesterday's VIX Action Hints At For Today


Somewhat unusual about the rise in the SPX Monday was that it was accompanied by a rise in the VIX as well.  Most of the time they mirror each other.  One quirk with the VIX is that it has a tendency to fall on Fridays and rise on Mondays. Therefore this setup is more common on Mondays than any other day of the week. The table below examines performance on Tuesdays after this has occurred.


I only show 1-day results here because anything longer shows no inclination.  And while the edge here isn’t terribly strong, it is interesting that the VIX’s inclination to rise on Mondays does not seem to completely eliminate the tendency for the SPX to pull back the next day.  Of course if this setup happens on a Friday, then the downside edge is more pronounced.

Friday, September 28, 2012

This Pattern Has Always Led to Higher Closes for SPY


The price action in SPY showed some real strength in that it gapped up, never filled, and closed above the open.  When the market is coming off an oversold level in an uptrend and is still not overbought, this pattern will often be followed by further gains.  This was shown in the subscriber letter last night (click here for a free trial).  And in the 5/22/12 letter I also showed that when the SPY pattern occurs following a short-term low it appears to provide a bullish edge, but when it occurs after an intermediate-term low then the bullish inclinations no longer hold true.  The current setup is bullish and I have updated the stats below.


The reliability and the size of the moves are both impressive.  This study suggests the rough start this morning is likely to be overcome in the next few days.

Wednesday, September 26, 2012

What Happens In Vegas

The International Traders Expo is going to be at Caesar's Palace from November 14-17, 2012.

I've been to this expo a couple of other times and have really enjoyed it.  I'm pleased to announce I'll be back this year and giving a presentation on Saturday the 17th from 1:15pm - 2:15pm.

The topic of my presentation will be "Overnight Edges - A Quantitative Look at Overnight Market Movements and Opportunities".  I'll be covering a lot of my newest and most compelling research with regards to the overnight market.

For more information and to register for the expo (free), click here.

I hope to get the opportunity to meet many readers and subscribers at the Expo.

Tuesday, September 25, 2012

Turnaround Tuesdays Revisited


It’s been a while since I updated the Turnaround Tuesday study, so I thought I would do so today.  The stats tables below all show results of buying at the close when SPX is down for a certain number of days and the exiting the following day.  The results are broken out by day of the week.  Note that the day listed is the trigger day – not the performance day.  So the Monday trigger tracks Tuesday’s performance.  Tuesday’s trigger tracks Wednesday’s performance…and so on.


In every case Tuesday has shown the most gains – hence the Turnaround Tuesday reputation appears well earned.  Though it wasn’t the highest percentage in every case, it was the strongest day on average.

Interestingly, I this time I also looked at instances where the SPX had pulled back more than 3 days.  Those results are shown below.


Under conditions of a 4 day or greater pullback Tuesday has disappointed.  Monday has been the standout winner.

But none of this tells the whole story.  For a more detailed breakdown of overnight vs. day gains I would suggest checking out the Overnight Edges TurnaroundTuesday study.  Results there are quite intriguing.


Monday, September 24, 2012

The Weakest Week (updated)

Last year I showed that the week following September options expiration has historically been the most bearish week of the year. 2011 didn't do anything to make the stats look any more bullish.  Below is an updated chart showing the persistently poor performance since 1961.


As you can see the bearish tendency has been pretty consistent over the last 51 years.  There was a stretch in the late 80’s where there was a series of mild up years.  Since 1990 it has been pretty much all downhill.

Monday, September 17, 2012

What Friday's VIX Action Hints At


Even with the SPX rising Friday, the VIX managed to close up a bit. The VIX will typically trade in a direction opposite the SPX, so it is unusual that they both close higher. On Fridays, the VIX has a natural tendency to dip in the afternoon, so it is most unusual to see them both close higher on Friday. The study below was last seen in 4/30/12 subscriber letter. It examines other instances of the VIX and SPX both closing higher on a Friday while the SPX is in an uptrending market. All stats are updated.


As you can see, there appears to be a decent downside edge suggested by this study. That edge has primarily played out over the first three days.

Friday, September 14, 2012

When The Fed Sparks A Rally To A Long-Term High


In “The Quantifiable Edges Guide to Fed Days” I discussed Fed Days that close at new highs.  The basic finding was that when the market closed at a short-term high on a Fed Day, then it was likely to pull back over the next few days.  But when it closed at a long-term high, then the rally was likely to continue.  Below is a study from the guide that.  I’ve updated all the stats.


This suggests further upside is likely over the next 1-2 weeks.

Wednesday, September 12, 2012

The Impact of Intermediate-Term Highs on Fed Day Performance


Tomorrow is a Fed Day. As I have discussed many times, Fed Days generally carry an upside tendency. But this tendency is greatly impacted by certain variables. A large collection of these variables may be found here on the blog under the “Fed Day”label. And many more may be found in the “Quantifiable Edges Guide to Fed Days”.

One variable I showed in January was whether the market was already at an intermediate-term high. There is a decent chance the market closes at a new high today so I've decided to update that study.

First, let’s take a look at SPX performance on Fed Days when the SPX has NOT closed at a 20-day high the day before.


That’s basically 30 ½  years of bullishness.

But now let’s see performance at times when the SPX did close at a 20-day high the day before.


No consistency and no pronounced edge in this sample of 37 instances.

Traders looking to play for a short-term Fed Day bump should perhaps be hoping the SPX does not close at a new high today.

Also, for more updated Fed Day research be sure to check out today's Overnight Overview at Overnight Edges.

Monday, September 10, 2012

A Pattern Of Strength Suggesting More Strength To Come


Short-term strength is often followed by short-term weakness, but when that short-term strength is unusually impressive, it can create a situation where that extreme strength will beget more strength. When the market leaves an unfilled up gap that is considered a sign of strength.  When it does it 2 days in a row and closes at a 50-day high, that can be considered exceptional strength. That is what happened on Friday, and past performance is shown in the study below.


The size of the follow-through isn't terribly large. But it has been very, very consistent that at least some follow through was achieved in the next few days.

Friday, September 7, 2012

One Strong Short-Term Positive About Thursday's Breakout


In the 7/19/12 blog I looked at the short-term importance of an unfilled upside gap accompanying a breakout.  With yesterday’s breakout occurring along with an unfilled up gapI have revisited that study below.


Results here are strong across the board.

Now let’s look at instances where the 50-day high breakout was not accompanied by an unfilled gap.  Interestingly, the number of instances was nearly the same.  This study also appeared in the 7/19/12 blog and is updated.


As you can see these moves to new highs that don’t start with an unfilled gap are much less reliable over the short-term.

Technicians will often use the term “breakaway gap”.  This suggests the gap occurs on the same day as a base breakout.  The idea is that the new high causes excitement and the gap leaves a good amount of people sidelined or stuck short.  When it doesn’t immediately fill, it leads these people to chase and helps to propel the market even higher.


Wednesday, September 5, 2012

Interesting Implications of the RUT/SPX Divergence on Tuesday


Last night in the Quantifiable Edges Subscriber Letter I examined short-term implications of strong 1-day rises in the Russell 2000 (RUT) while the S&P 500 (SPX) declined. I found that there appeared to be a decent upside inclination for the following day. This morning I played around with this concept a little further, added a filter that eliminated instances occurring in conjunction with intermediate-term lows, and ran the test out longer. What I found was quite interesting and can be seen in the stats table below.


While 1-day implications appear bullish, looking out over the next couple of weeks there has been a strong downward tendency. This may be worth keeping in mind over the next 10 days or so.

Friday, August 31, 2012

Friday Before Labor Day Seasonally Strong


The Friday before Labor Day has long been a strong seasonal day for the market.  Below is a stats table based on buying the Thursday before Labor Day and selling the close on Friday.


With 71% of the days finishing higher, a profit factor of over 2.5, and an average trade of 0.3% the stats are quite compelling.  Futures are up pretty strong right now, so this one has a head start.  But gold subscribers were alerted to this in yesterday afternoon's Quantifinder, and Overnight Traders were also made aware of the strong seasonality yesterday afternoon.

Wednesday, August 29, 2012

Revisiting Strong Breadth on Down Days


Despite the SPX closing lower yesterday, the NYSE saw 56% of its issues close higher.  This brought about a study that I last showed in the 6/29/12 blog.  Results are updated.


The numbers here suggest an upside edge.  While not extremely powerful, it does appear to be nicely consistent over the first few days.

Tuesday, August 28, 2012

Facebook Me!


So it is probably 3 or 4 years beyond when I should have done this, but Quantifiable Edges is finally on Facebook! I've set up the page so that all tweets and blogs appear in the timeline.

So for those of you that "like" Quantifiable Edges and would like the tweets and blogs delivered into your newsfeed, you can easily do so.

If you prefer to keep Quantifiable Edges out of your newsfeed, you can still "like" the page and then easily hop over there while in Facebook to check any new activity.

I'm fairly new to all this Facebook stuff, but it seems pretty slick to me, and a nice option for Facebook users to keep up with Quantifiable Edges. I suspect I'll need to have some kind of "like me" contest soon.

And yes, the new Overnight Edges website is also on Facebook.

You may check out the Quantifiable Edges Facebook page here.

The Overnight Edges Facebook page can be found here.

Monday, August 27, 2012

Mega-Outside Days


Friday was what I call a mega-outside day. It didn't just make a higher high and a lower low (a regular outside day). It actually opened below the low of Thursday and closed above the high of Thursday. This is unusual, and in the past it has led to a dip over the next few days.


Stats here look strongly negative over the first 1-2 days, with most of the downside occurring on day 1.

Friday, August 24, 2012

The June 12th FTD was a Success


When SPX hit a new high on Tuesday (Aug 21st), doing so deemed the 6/12/12 Follow-Through Day (FTD) “successful” according to the possible definitions of “success” I included in the FTD studies.

Based on a number of the FTD studies, this one bucked the odds.  For one, it came on moderate volume.  Secondly, breadth was unremarkable.  And lastly, it occurred in June.  It was only the 8th FTD to occur in June since 1971 and only the 2nd one to succeed.

Despite all this, the rally went on to new highs.  That's why I talk about odds and not certainties. This FTD will now be clustered in with the rest and the odds will be recalculated next time one occurs.

Wednesday, August 22, 2012

When QQQ Posts 2 Outside Days in a Row


Tuesday marked the 2nd day in a row where the QQQ made a lower low and a higher high.  Days that do this are often referred to as “outside days” because they trade outside the range of the previous day.  When QQQ has posted back to back outside days in the past, it has often been followed by a short-term rally.  I last showed this in the 11/10/10 blog.  I posted a link to that blog via Twitter yesterday afternoon.  I have updated the stats table below.


Results still appear strongly positive.

Tuesday, August 21, 2012

Consistent Closes Near the Top of the Daily Range - And What That Could Fortell


The market has seen a lot of finishes near the top of its daily range lately.  When the market consistently closes near the high of the day it suggests optimism on the part of traders. This end-of-day optimism is now at a level that suggests it is a bit overdone and there is a good chance of a pullback. The study below was last seen in the 7/5/12 blog and it exemplifies this concept. I have updated all of the statistics.


While the downside edge appears to remain in place for a full week, most of the edge has been realized over the 1st 2 days.

Note: To calculate the “8-day Average Closing % Range” I am simply measuring where in the daily range SPY closed each day. For instance if it traded at a low of $141.00 and a high of $142.00 and closed at $141.75, then it would have closed in the 75th percentile of the daily range. A close at $141.50 would have meant 50%.

I then take a simple moving average of the last 8 days. If that average goes from below 75% (where it usually is) to above 75%, the study is triggered.

Friday, August 17, 2012

Quantifiable Edges new baby - Overnight Edges


I can't tell you how excited I am to announce the launch of Overnight Edges. Overnight trading is something I've spent years studying, implementing, and refining.  I've kept quiet about it for far too long.  Now I’m finally ready to share it with the world!  I’ll write more on it in the near future, but today I just wanted to formally announce that Overnight Edges is LIVE!  Check it out at

Thursday, August 16, 2012

What to do when you have no edge


Motionless markets like we’ve been in lately can be a real test of patience.  Michael Covel posted a great clip from Boardwalk Empire recently that talks about the importance of patience when you have no substantial edge.  Hat tip to Charles Kirk for making me aware of it.  (There is some foul language in the clip.)

http://www.michaelcovel.com/2012/08/06/the-definition-of-an-asymmetric-bet/


Wednesday, August 15, 2012

Is The Recent Consolidation Bullish?


The range over the last week has been extremely tight.  Every SPY close in the 5 days since 8/7 has been within the daily range of that 8/7/12 bar.  It is said that consolidations are often resolved in the direction of the trend.  This guideline suggests that we’re more likely to see another leg up from here than a breakdown.  The study below puts this to the test.


It certainly appears the old technical adage has some merit.  Results favor the long side over the immediate 3-day period and they are even more impressive when looking out 8 to 10 days.

Tuesday, August 14, 2012

Why The Recent Move Higher May Signal More Gains


One possible market positive is that prior to small drop Monday's drop the SPX was locked in a persistent rally. I've shown a few different ways in the past that persistent rallies are unlikely to end abruptly. Instead they will either continue higher after a brief pullback, or action will become choppy prior to a sizable move lower. This is shown in the study below.


We see here a decent edge that becomes stronger and more consistent as you look out over the next several days.  The 9-10 day time frame shows exceptional stats.  The 2-day timeframe suggests a quick little boost is also likely.

Friday, August 10, 2012

Implications of 10-yr Bond Rates Hitting New 50-day Highs Along With SPX


Ten year bond rates hit a new 50-day high on Thursday in conjunction with the 50-day high in the SPX.  This is something I have looked at in the past, and the intermediate-term implications suggest possible difficulty.  I’ve shown this study a few times on the blog, most recently last October 31st.  The last time it triggered was March 13th.  I have updated the results below.


Generally it seems that higher interest rates have often made bonds an attractive investment. This may have lead people to forsake stocks in favor of lower risk returns with improved yield.  Of course the “high” yield we are now seeing certainly does not seem high.  Still, this study has triggered a number of times over the last several years and it continues to suggest struggles for the SPX.  So it seems worth being aware of.

Tuesday, August 7, 2012

A Bullish Study That is Re-Triggering


I mentioned yesterday that I am seeing a real mix of studies, and that remains true.  So after showing one for the bears yesterday, let’s look at a bullish one today.  You’ll hopefully recognize it because it last triggered just over a week ago.  I showed it in the July 30th blog and have updated the results below.


The last instance was followed by a 4-day pullback and then a very large rally on day 5 that wiped out all the losses.  Results have consistently led to at least some upside over the short-term.

There remain both positives (like today’s study) and negatives (like yesterday’s) to take into account.  Perhaps a little caution is warranted.

Monday, August 6, 2012

A Gap Pattern Suggesting A Pullback


I am seeing a real mix of studies right now.  The one below makes a short-term argument for the bears.  It examines the unfilled gap pattern that emerged in the SPY on Friday.   The study was last shown in the 10/28/11 subscriber letter. I ran it again this weekend.


The number of instances is a bit low, but the consistency is strong enough and the statistics lopsided enough that I think it is still worth taking the study under consideration.