Tuesday, January 22, 2013

MLK Week Historical Returns


Martin Luther King Jr. Day was Monday. The NYSE has only observed MLK Day as a holiday since 1998. But over that 15 year period the market has not done well during MLK week.  I discussed this last year in the 1/17/12 Subscriber Letter.  Below is an updated chart with stats showing performance for the whole (4-day) week over time.


MLK week has exhibited a bearish tendency over the last 15 years.  The market has been strong lately, but if it is going to pull back this upcoming week could be an opportune time for the bears.

Friday, January 18, 2013

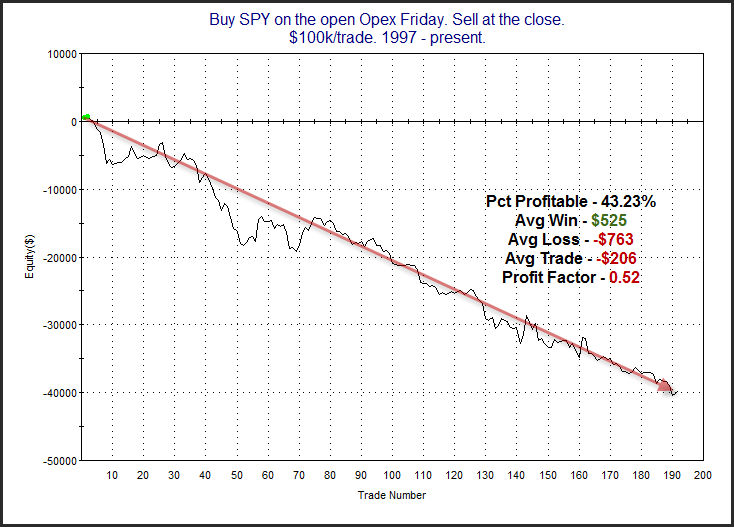
An Opex Friday Daytrading Edge

Here's a little study for daytaders that we've discussed in some detail in the Overnight Edges trading room.


Over the long haul there has been a definite downside edge between open and close on Opex Friday.

Wednesday, January 16, 2013

Why Consistently Strong Closes May Not Be A Good Thing


The market has seen a lot of finishes near the top of its daily range lately.  When the market consistently closes near the high of the day it suggests optimism on the part of traders. This end-of-day optimism is now at a level that suggests it is overdone and there is a good chance of a pullback. The study below was last seen in the 8/21/12 blog and it exemplifies this concept. I have updated all of the statistics.


While the downside edge appears to remain in place for a full week, most of the edge has been realized over the 1st 2 days.


Note: To calculate the “8-day Average Closing % Range” I am simply measuring where in the daily range SPY closed each day. For instance if it traded at a low of $146.00 and a high of $147.00 and closed at $146.75, then it would have closed in the 75th percentile of the daily range. A close at $146.50 would have meant 50%.

I then take a simple moving average of the last 8 days. If that average goes from below 75% (where it usually is) to above 75%, the study is triggered.

Monday, January 14, 2013

January Opex Weak


As I discussed last month, opex week in December has historically been wonderful.  But January – not so much.  Below is a list of the last 14 January opex week returns.  While it is not the case this year, January opex week often occurs in conjunction with Martin Luther King Day. So some of these weeks contained four trading days and some contain five.


As you can see there has been a decided downside tendency over the last 14 years.  And despite last year’s strong performance the drawdown / run-up stats at the bottom remain especially compelling for the bears.

Tuesday, January 8, 2013

2012 Was Another Strong Year For The Quantifiable Edges Big Time Swing System

I’ve updated the Quantifiable Edges Big Time Swing System overview page with results through January 3rd, when the most recent trade closed out. There is not a trade currently open. Since the system only averages about 1 trade per month, I typically update the results bi-annually. Since the last update after July 2, 2012, through January 3, 2013, the signals produced a net return of 9.04% for SPY (including dividends, commissions of $0.01/share, and an assumed interest rate on cash of 0.1%).  This was achieved with 6 long-side trades and 0 short trades.  Five of the six trades made money.  The system is also again at new equity highs.  In total, 2012 posted a net gain of 9.12%, and 2013 is already up 2.51%.

The Big Time Swing System provides easy to follow mechanical rules. The standard parameters are not optimized and have performed quite well (they are the ones used for all performance metrics). There are only about 11 trades per year averaging 7 trading days per trade. All entries and exits are either at the open or the close. And to be sure you have everything set up properly traders may follow the private purchasers-only blog that tracks all SPY signals and possible entry/exit levels. This service is free for 12 months from the date of purchase.

For system developers looking for a system that they can use as a base to build their own system from, the Big Time Swing is an attractive option. It is all open-coded and comes complete with a substantial amount of background historical research. And since it is only in the market about ¼ of the time, it can easily be combined with other systems to provide greater efficiency of capital. Once you’re ready to try and improve the system yourself you can also refer to the system manual or the August 2010 purchaser-only webinar – both of which discuss numerous ideas for customization.

For more information and to see the updated overview sheet, click here.

If you’d like additional information about the system, or have questions, you may email BigTimeSwing @ Quantifiable Edges.com (no spaces).

Monday, January 7, 2013

Why the Persistently Low VXO is an Uh-Oh


Both the VIX and VXO (which is the old calculation for the VIX) closed well below their 10-day average for the 3rd day in a row on Friday.  This action in VXO triggered a study that I last discussed here on the blog on July 5, 2011 (though I have discussed it in the subscriber letter a few times since).  It looks for stretches of 15% or more below the 10ma that persist for 3 days.


Based on the stats table there appears to be a downside inclination. I find the note at the bottom of the study to be especially interesting. Nearly every case has experienced an almost immediate pullback, but those that didn't went without pulling back for a long time.

Wednesday, January 2, 2013

1% Gaps Higher to Start the Month


Fiscal cliff news has the market set to gap up strongly this morning.  The 1st day of the month is often a strong one for stocks, but how has it done intraday when it gapped up big to begin with?  That is what I looked at this morning.


6 of the 9 instances since 2003 have closed above the open.  Gross gains have been about 2.2 times the size of gross losses, and the average trade rose a little over 0.4% from open to close.  But with instances low I wouldn’t put a lot of faith in these numbers.  Early indications favor more upside but it is certainly not a clear-cut edge.