Monday, November 30, 2009

Friday's Breadth Was SO Negative...It Could Be Positive

Friday’s selloff was marked by extremely negative breadth. Around 97% of the volume was to the downside on the NYSE. In the past, days that have been SO negative have often led to bounces over the short-term. This can be seen in the study below.


The “% Profitable” is positive but not overwhelming. Risk/reward is pretty solidly bullish, though with the"Avg Trade" showing some strong numbers.

Wednesday, November 25, 2009

My Interview From The Kirk Report Is Now Available

In September as part of his trader interview series, Charles Kirk of The Kirk Report interviewed me. Charles has been kind enough to allow me to republish the interview, which previously was only available on the members section of The Kirk Report.

If you’ve ever had questions about my approach, then be sure to check it out. Charles probably got the answer out of me. Even those who are very familiar with my work will find new material in the interview. Charles got me to discuss ideas and methods that I’ve never discussed on the blog or in the Subscriber Letter before. The interview is lengthy, but with the slow trading and extra time off over the next few days I thought some readers might find it interesting. There is a link below, and I have also posted a permanent link on the Quantifiable Edges home page.

http://www.quantifiableedges.com/kirk-hanna.html

Happy Thanksgiving!

Vegas Traders Expo Wrapup & Links

I wanted to briefly discuss the Vegas Traders Expo I attended last week. I enjoyed the Expo greatly. While there was a good number of unsubstantiated claims by certain speakers, I was pleased to see that several speakers took the time to quantify their methods. Two that come to mind were Larry Connors and Buff Dormeier.

Larry discussed some of his TradingMarkets work.

Buff discussed his Volume Price Confirmation Index (VPCI), which he won the Charles H. Dow award for in 2007. For those who may not have read Mr. Dormeier’s paper I would suggest it. It may be found using the link below:

http://www.mta.org/eweb/docs/2007DowAward.pdf

In fact, all past Dow Award winning papers back to 1994 may be found here:

http://www.mta.org/EWEB/dynamicpage.aspx?webcode=charlesdowaward

Other traders whose work I respect greatly and had a chance to meet and talk with at the expo include:

Scott Andrews of Master the Gap. Scott’s focus is trading the opening gap – primarily in the S&P futures. He uses statistics and backtesting to develop his techniques.

Tim Bourquin of TraderInterviews.com - a unique site that interviews traders to provide insights into how they make money.

Dave Mabe of Stocktickr. The Stocktickr product helps traders to track, segment and journal their trades. I strongly believe it’s important to understand what’s working and what isn’t among a traders strategies and this product seems to do a nice job of assisting with that.

Corey Rosenbloom of Afraid to Trade. Corey focuses on intraday trading and technical analysis. He looks for trade confirmation using several techniques including Fibonacci, Eliot Wave, and tick analysis.

I also enjoyed meeting and speaking with several Quantifiable Edges readers and subscribers.

Monday, November 23, 2009

A Daily Breakdown Of Thanksgiving Week History

Seasonal influences are often cited around the Thanksgiving holiday. Therefore I decided I would examine returns during Thanksgiving week as well as the Monday following. Below is how the SPX has performed around Thanksgiving over the last 48 years.


Monday and Tuesday don’t seem to carry a sizable edge. Monday’s total return was actually negative prior to 2008 when it posted a gain of over 6%. Also notable is that the Monday AFTER Thanksgiving’s stats were skewed a bit by the 2008 results. Last year saw a drop of over 8% on that day. Even excluding 2008 there is a bit of a bearish edge apparent on the Monday following Thanksgiving.
Wednesday and Friday surrounding Thanksgiving have been the most consistent and bullish days of the period.

Monday, November 16, 2009

What A Strong Early Tick Has Meant In The Past

The market is off to a strong start today. The NYSE Tick did not post a negative reading for the 1st half hour of trading. This is fairly unusual, having happened only 64 times since the beginning of 2005. Below are stats showing how the SPY has performed the rest of the day after the TICK got off to such a strong start.


Nearly 2/3 of the time the market has managed to follow through with more gains from 10am until the close. Stats are a little skewed by the huge 7.5% gain that occurred on 10/13/08. The average loss was fairly small at around 0.5%. Overall, a very positive start like we’re seeing this morning has often been good news for the rest of the day.

Of course there is a little speech today from Chairmen Ben…

Vegas This Week / SPY Volume Low Again Friday

Research posting may be light this week as I travel to the Las Vegas Traders Expo. My presentation will be Thursday at 1:15pm. As well as discussing some concepts and edges I’ve covered here or in the Subscriber Letter over the last few years, I’ll also be unveiling some new research. I’m looking forward to meeting readers and subscribers at the show.

I may act more as a reporter/blogger later this week and provide some thoughts about the show and my experience there.

Notable about Friday’s action was that volume was again light on the rally. This has often led to a short-term pullback in the past. Below is a link to an April 2009 post that looked at SPY action as was seen on Friday. The study was one of several identified by the Quantifinder on Friday.

http://quantifiableedges.blogspot.com/2009/04/is-buying-drying-upagain.html

Thursday, November 12, 2009

VIX Rises As SPX Hits New High

In a somewhat unusual move, while the SPX was closing at a 50-day high yesterday, the VIX actually closed higher. Below is a look at other times this has happened during the middle of the week.


These stats suggest a downside edge. Apparently the VIX should not be on the rise when the SPX is hitting new highs. The fact that it rose Wednesday implies a short-term pullback.

Tuesday, November 10, 2009

Low SPY Volume Could Signal A Pullback

The last couple of days I’ve published some bullish studies that showed Nasdaq breadth data and VIX action were indicating further rises. The market followed up by meeting the objectives of these studies very quickly. Today I’ll mention what’s NOT so great about this rally – volume. On Friday NYSE volume came in low. While it rose some Monday, SPY volume faltered. It triggered a couple of bearish studies that were identified by the Quantifinder. I’ve linked to those studies below.

This first one looked at declining volume on a streak of higher closes.
http://quantifiableedges.blogspot.com/2009/09/spy-rising-while-spy-volume-declines.html

The second one looked at 20-day volume lows when the market is in the upper end of its range.
http://quantifiableedges.blogspot.com/2009/04/is-buying-drying-upagain.html

So while other indicators have been positive, volume is currently the squeaky wheel.

Monday, November 9, 2009

VIX Goes From Overbought To Oversold In 5 Days

The VIX has moved from overbought to oversold quite quickly this past week (based on its stretch above and below the 10-day average). This brings up the question of whether the now “oversold” VIX is suggesting a selloff for the S&P. I took a look at similar past situations.


Results have been inconsistent but risk/reward has generally favored more upside over the coming weeks. This would seem to make sense since what you’re typically looking at in the SPX with the above setup is a strong rebound from a sharp decline during a long-term uptrend.

I am seeing some signs the market is nearing a pullback. The VIX action is not one of those signs.

Friday, November 6, 2009

Extreme Nasdaq Breadth Suggests Higher Prices

While most everything did well on Thursday, much of the excitement was directed towards smallcaps and Nasdaq stocks. Below is a little study that shows how the market has performed in the past following such buying interest in the Nasdaq while the S&P 500 was in a long-term uptrend.


Instances are lower than I’d typically like to see, but with all 7 closing higher in the next day or 2, this study appears worth noting. Extremely strong volume breadth going into riskier Nasdaq stocks has often led to some follow through when the market is in a long-term uptrend.
Of course the jobs report may have a little something to say about today's action as well...

Wednesday, November 4, 2009

Fed Studies

I am off this morning to go get a root canal, so no time for anything new. With the Fed announcement coming later today, you may want to review some of the old Fed Studies.

Tuesday, November 3, 2009

What's Been Happening With The CBI

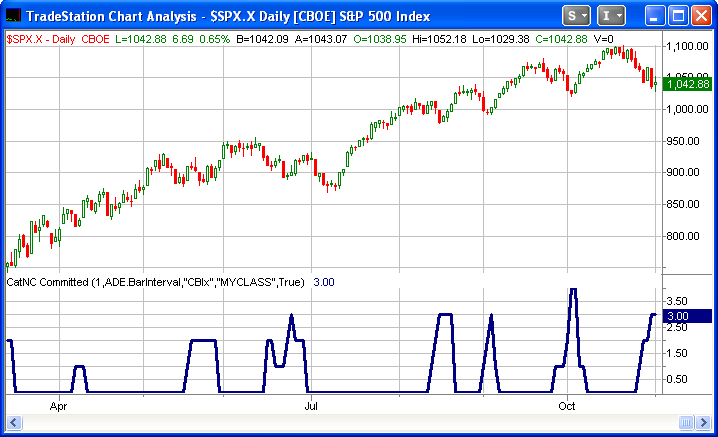
So I’ve been asked a few times, “what has been happening with the Capitulative Breadth Indicator (CBI)?” No I haven’t stopped tracking it. There just hasn’t been a significant reading since the March bottom. Below is a chart I post to the members section of the website every night.


As long-time readers may recall, I don’t normally view CBI readings below 5 as any kind of warning sign. It’s not until readings reach 10 or more that they become highly indicative of an upcoming oversold bounce. We haven’t seen a reading above 4 in almost 8 months now. Even the current selloff has only seen the number move up to 3. It also appears unlikely to move substantially higher in the very near term. While other breadth readings like the McClellan Oscillator have been reaching extreme levels, the CBI requires more intense selling among individual issues – not just a broad decline. I’ll discuss the CBI again when more significant readings arrive.

For those who would like to learn more about this inidicator, you may check out the CBI label on the right hand side of the page.

Monday, November 2, 2009

Do Very Bad Fridays Set Up Crash Mondays?

Many traders who are aware of the history of the ’87 crash may often think after a bad Friday, “Will this get substantially worse on Monday? Are we setting up for a crash like ’87?” It’s an interesting question. Was 1987 an anomaly or does a really bad Friday often carry through into the next week? Below I looked at all Fridays since 1960 that closed down at least 2.5%.


The “Average Trade” column on the far right is skewed thanks to the ’87 crash which saw the market drop 20% on Monday. It appears in the almost all of the cases that the market was set up for a bounce based on Friday’s action rather than a crash. Of course while the last week has been bad, the market does remains in a long-term uptrend. I decided to filter the above results again to examine the bad Friday’s that appeared in long-term uptrends.


Instances are low here, but for the short-term they really couldn’t be more bullish. Again they also suggest the bounce should basically come immediately.