Showing posts with label Intraday. Show all posts

Tuesday, December 31, 2013

Should You Quit Trading Early Today?

The table below is from a study I showed in last night’s subscriber letter.  It shows how SPY has performed every year, during the last 15 minutes of trading for the year.


On average SPY has lost 0.25% in the last 15 minutes of trading.  And if you just look at the losers, the average loss was 0.345%.  Last year was the 1 big up year (excitement over avoiding the Fiscal Cliff?).  If you are a daytrader with a long position, this might be a good day to close up shop 15 minutes early…

Tuesday, August 13, 2013

No Turnaround Edge This Tuesday?

Tuesday has shown strong inclinations to turn around over the years when there has been a pullback leading up to it.  But when the pullback has been 2 days old and the market has been in a long-term uptrend, that turnaround inclination has not held true.

Whose fault is that?  Not the overnight.

It's been the day session.  Below is a are the results of going long Tuesday morning after a 2-day pullback during an uptrend, and then exiting at the close.


As you can see, the stats show a moderate downside inclination.  I also produced a profit curve to see how this has played out over time.


A bit choppy, but it has been headed lower for a long time.  Traders may want to be a little cautious about jumping aboard the "Turnaround Tuesday" train today.  The market has historically struggled between open and close under similar scenarios.

Wednesday, March 27, 2013

An Intraday Look At Holy Thursday Historical Performance


Last year I showed that the Thursday before Easter (also known as Holy Thursday) has exhibited a bullish inclination over the years.  Today I thought it would be interesting to break out that performance by overnight vs. intraday returns.  Intraday returns will be shown here.  Overnight returns can be found on Overnight Edges.

The study below shows historical performance from open to close on Holy Thursday.


Numbers here are solidly bullish, though not as overwhelming as the total numbers would suggest.  This is thanks to much of the strength coming the night before.  Below is the list of instances.


Instances highlighted in purple are the 5 that started with a gap down.  All 5 of these gaps were filled at one point during the day, and all 5 instances saw SPY close above where it opened (with 2 of them making for the largest 2 gains of the 19 listed).

There are numerous ways to try and take advantage of this information.  In general, traders should be aware that Holy Thursday has exhibited seasonal strength, and that strength has often begun to exert itself the night before.  For a more detailed breakdown of the overnight returns, check out today’s Overnight Edges blog post.

Friday, January 18, 2013

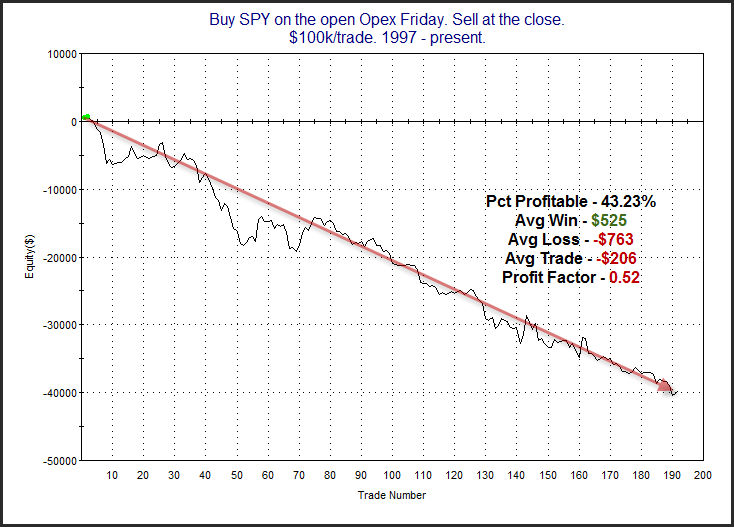
An Opex Friday Daytrading Edge

Here's a little study for daytaders that we've discussed in some detail in the Overnight Edges trading room.


Over the long haul there has been a definite downside edge between open and close on Opex Friday.

Monday, April 9, 2012

The Market Avoided This Bearish Daytrade Setup By Seconds

On March 2 I discussed a setup in which the NYSE TICK manages to trade above 0 for the entire 1st 30 minutes of the trading day.  Such a setup used to suggest bullish implications, but that no longer appeared to be the case.

I also have an old study that looks at the other side of the coin.  What if TICK goes the 1st 30 minutes and trades BELOW 0 the whole time?  This NEARLY triggered this morning.  The TICK managed to move up through 0 in the 30th minute.  But let's take a look at it anyway.

In the past I have shown this to suggest bearish implications.  Here is an updated look at those statistics:


Everything here still suggests bearish implications.  An average loss of an "additional" 0.75% between 10ma and 4pm is quite large.  But let's take a look at the equity curve to see how the edge has played out over time.


While recent instances have not been as powerful as some we saw in the past, the downside still appears to be intact.  It may be waning, but it still appears prevalent enough to raise a red flag.

So did we narrowly miss a bearish setup, setting the stage for an intraday rebound?  Or was this one close enough that the bears are likely to remain in control the rest of the day?  We'll find out in a few hours...

Thursday, February 4, 2010

What A Very Weak Early TICK Has Led To In The Past

The market is off to a horrible start today. Back in November I looked at days that started off strong and did not register a negative TICK reading for the entire first half-hour. Strong starts often led to strong finishes. Today there were no positive TICK readings for the 1st half-hour. This kind of weakness happens quite rarely. When it has occurred in the past, it’s made for some very rough days. Below are statistics showing the 10am – 4pm EST performance after such weak starts.


Certainly not a knife you want to normally try and catch.

For those who would rather view it as a short-selling opportunity, here’s how it looks from the short side.


No matter how you view it, very weak starts like today tend to carry big risk and little reward for the bulls for the remainder of the day.

Monday, November 16, 2009

What A Strong Early Tick Has Meant In The Past

The market is off to a strong start today. The NYSE Tick did not post a negative reading for the 1st half hour of trading. This is fairly unusual, having happened only 64 times since the beginning of 2005. Below are stats showing how the SPY has performed the rest of the day after the TICK got off to such a strong start.


Nearly 2/3 of the time the market has managed to follow through with more gains from 10am until the close. Stats are a little skewed by the huge 7.5% gain that occurred on 10/13/08. The average loss was fairly small at around 0.5%. Overall, a very positive start like we’re seeing this morning has often been good news for the rest of the day.

Of course there is a little speech today from Chairmen Ben…

Thursday, April 23, 2009

Late Day Reversal Flips S&P To Negative

We’ve seen before how strong end-of-day selloffs are often an overreaction. Frequently this means a bounce back over the next day or so. Tonight I looked at the below situation, which describes Wednesday's action:


Instances are low, but the results are interesting. The pattern is a sharp bounce followed quickly by another drop lower. Of the 9 instances, 8 of them closed higher than the entry trigger at some point in the next 3 days. Amazingly, 7 of 9 closed lower than the entry trigger within 4 days. Looking out 6 days would move the number to 8 of 9 and if you give it 6 days, then all 9 instances closed lower at some point. What I see is a propensity for violent chop over the next few days.

Thursday, October 30, 2008

Overly Strong Reactions Are Often Overreactions

If you left 10 minutes early on Wednesday you missed a lot. The S&P lost over 3% from 3:50 to 4pm and was down over 4% before bouncing in the last minute. I looked back over the last 25 years to find other times the market dropped 3% or more in the last 10 minutes of the day. This was the 1st. Lowering the requirement to 2% unveiled 3 instances. They are listed below along with the next day’s performance:

10/19/87 – S&P rose 5.23% the next day.
9/29/08 – S&P rose 5.27% the next day.
10/27/08 – S&P rose 10.79% the next day.

This is too small a sample size to use for analysis, but a nice illustration of a simple adage. An overly strong reaction is often an overreaction.

Friday, August 22, 2008

Trend Vs. Chop For Intraday Traders

Yesterday’s post looked at the propensity of the market to chop vs. trend. The basic conclusion was that the market has shown less tendency to trend and more tendency to chop over the last few years. This was especially evident when looking at a long-term chart.

Today I’m going to show the tendencies on an intraday basis. The break down will be similar to yesterday. The first chart shows results of buying any up bar and then exiting on any down bar. 15 minute bars are used for all the tests below.
A rising graph would show a propensity to follow through and a falling graph would show a propensity to reverse. A flat graph wouldn’t favor either. One note about all these graphs is that the day is closed out flat. There is no overnight holding since we are only measuring intraday tendencies. Throughout most of the 90’s, the easiest way to make money intraday was to find an uptrend an jump on it. As with daily bars, that seems to have changed over the last several years.

What about shorting down bars? How has that worked?


Similar to buying strength, shorting weakness worked well in the 90’s. Over the last few years it has struggled. Even with the difficult stock market performance this year, downmoves have shown a higher propensity to reverse than to continue. The May-June period was a notable exception.
Now for the combination. The rules are basically the same as yesterday buy on an up bar and then reverse and short on a down bar. Again – no overnight holding since intraday trends are the issue.

No surprise here –trending behavior was favored until around 2003 when the market shifted to a significantly more choppy environment. The most pronounced choppiness has occurred in the last year and a half, suggesting the last year and a half has rewarded intraday reversal trades and punished intraday trend trades more than any time in the last 15 years.
Now for the long-term look back. For this test I was able to run the data back a little over 25 years.


As was seen with the daily bars yesterday, the propensity to reverse rather than trend is a relatively new phenomenon. Intraday traders would do well to consider the consequences of these tendencies when developing intraday strategies.

Thursday, April 24, 2008

Intraday Extremes

The price action on Wednesday was quite interesting from an intraday perspective. I've posted a chart of SPY below. What sticks out to me it the fact that there were two extreme price moves in close proximity of one another. The chart is a five minute chart, which is the intraday chart I look at most often. Notice the two arrows with notes attached.


When you get a strong and steady move like was seen from 10:10 to 10:55 or in the opposite direction from 11:55 to 12:25, one indication that it may be nearing its end is if a large range bar is posted.

To help illustrate this concept I ran some historical studies. The first one looks to sell short any time there have been at least 6 up closes and the most recent bar makes the largest rise of any bar in the move. It then sells “X” bars later or at 4:00 – whichever comes sooner. No trades are taken before 9:50.

As you can see, selling into this extreme move has a positive expectancy from 5-50 minutes out.

The second study looks at exactly the opposite formation. It buys the SPY any time there have been at least 6 down closes and the most recent bar makes the largest decline of any bar in the move. It then covers “X” bars later or at 4:00 – whichever comes sooner. No trades are taken before 9:50.

Again you can see that the edge is for a counter-move rather than a continuation for at least the next 5-50 minutes.

The large bar after the steady trend many times signals a blowoff. It can be a good place to take profits if you are in a trade, or perhaps begin to look for a reversal. This is not a daytrading system by any stretch, but it does illustrate a concept that daytraders may want to keep in mind.