Showing posts with label volume. Show all posts

Thursday, March 8, 2012

The Link Between Junior High School Girls and Stock Market Bounces

Below is a study I showed in last night’s Subscriber Letter (click here for a free 1-week trial). It considered volume’s impact on a short-term oversold bounce. It also utilized a long-term trend filter.


These results suggest there should be more upside to this bounce. Statistics across the board are impressive over the next week.

But does the low volume really matter? To answer this I ran the same study below but flipped the volume requirement and insisted volume come in higher.


Volume accompanying a move can signify enthusiasm for the direction of the move. Short-term oversold bounces sometimes remind me of junior high school girls. Back when I was in school, if you wanted a girl to like you then you had to make sure she didn't think you liked her. Showing any enthusiasm would scare them off quickly. You had to play it cool, man. It appears that is what the bounce did Wednesday - it played it cool, man. And now it's chances are better.

Tuesday, November 15, 2011

Low Volume A Possible Concern

Monday’s extremely low volume could be a short-term bearish sign. The 0.96% drop did not quite qualify for this 2008 study, but below is another past study that does exemplify the low-volume issue. Rather than index volume, it uses SPY volume. Either one would yield similar results in this case.


While not the most overwhelming edge we’ve ever seen, it does seem to strongly suggest that caution is warranted.

Tuesday, October 25, 2011

Very Low SPY Volume At A New Intermediate-Term High

SPY volume came in at the lowest level in over a month on Monday. Very low SPY volume when the market is at or near highs is often a bearish sign. A few studies related to this appeared in the Quantifinder this evening. I decided to examine the combination of a 20-day low in volume combined with a 50-day high in price.


Over the next 2 to 3 days there appears to be a solid downside edge based on the numbers. While I expected this to be the case, I was somewhat surprised to see that the edge persisted well beyond that. While I frequently show profit curves in the Subscriber Letter, I rarely do so on the blog. Today I decided to show it. So here it is using a 2-day holding period.


The consistently down sloping curve appears as impressive as the numbers.

Monday, July 25, 2011

Very Low Volume At A New Short-Term High

I have been away for a while.  When I’m away subscriber services continue pretty much as normal but blog posts tend to suffer.  I’m back and will have a couple of posts this week and then get back to the 3 or so per week starting next week.


Very light volume at new highs as we saw on Friday often indicates a rally is running out of buyers.  Frequently such light volume is followed by a pullback in the next few days.  There were several studies that appeared in the Quantifinder Friday that demonstrated this point.  I’ve chosen one that was also in the Subscriber Letter to highlight below.  Blog readers last saw this study on April 5, 2011.


This study looks back to the inception of the SPY in 1993.  The numbers above look fairly compelling.  I also found the edge to be quite steady over the tested period.  Of course with the gap down in the futures, much of the downside edge may be realized quicker than usual today.  It’s possible it won’t persist for as long.  Nonetheless, as I’ve shown many times before, volume does matter and traders should pay attention to it.

Tuesday, April 5, 2011

Low SPY Volume A Concern

SPY volume came in at the lowest level in a long while on Monday.  I've shown numerous volume studies in the past suggesting price highs and volume lows are typically followed by a pullback.  Below is a study from last night's letter that examines the current setup.


The numbers here are fairly compelling, especially considering the studies used a long-term trend filter.  Bulls may not want to get overly aggressive in the next few days.  Risk appears elevated.

Wednesday, February 9, 2011

Very Low Volume at a New Intermediate-term High

Low volume at a new high can often be concerning, whether it be NYSE volume or SPY volume.  In last night's subscriber letter I looked at a couple of volume-related studies with moderately bearish inclinations.  I then combined them to see what would occur.  The study below shows the result of the combination.


Now the number of instances is quite a bit lower here than I typically like to see, but I found the results  interesting and the consistency extremely strong. 

Thursday, February 3, 2011

Low Volume Pullback

More than anything it was the light volume that appeared most notable about Wednesday's action.. Light volume pullbacks are generally regarded as bullish. Yet in my research I have found that when pullbacks begin on very light volume the pullback has a good chance of deepening. Today’s mild pullback in the SPX occurred on the lightest NYSE volume in over 2 weeks.


These results suggest a mild bearish edge over the 1st 6-7 days. The edge is not the most reliable as the “% Profitable” is close to a coin toss. The edge lies in the fact that downside risk has strongly outsized reward.  I took a more detailed look at this last night in the subscriber letter.
 
A few caveats to consider.  The huge snowstorms may have had a dampening effect on volume.  Also, while this study suggests a possible downside edge, there are studies I am seeing that suggest upside.  Things aren't cut and dry right now.

Friday, January 28, 2011

Low SPY Volume At New Highs A Possible Concern

Last week I showed a study that suggested the 1/18/11 move to new highs on strong volume suggested more upside was likely in the next couple of weeks. Despite a quick initial dip, the market has recovered nicely and is again making new highs. But this time the volume is dropping as we go higher – the last 2 days if you use SPY volume as a proxy. We’ve now had two consecutive 50-day closing highs and seen volume decline both days. This pattern was identified by the Quantifinder and I have updated the study below.


The stats table appears to suggest a relatively mild, but consistent, downside edge. The bearish influence is primarily exhausted within the first two days, though.

Wednesday, January 19, 2011

New Highs on Strong Volume Typically a Positive

Tuesday’s rally came on the highest NYSE volume in 20 days. This is something I examined in last night’s Letter. One filter I’ve found helpful in the past is excluding op-ex Fridays since they will so often post extremely high volume. Below is a stats table from my examination.


These results appear to be very solid for both the short and intermediate-term.


I will note that there are a number of short-term studies pointing south right now. These include studies related to SPY patterns, VIX movement, and seasonality. So immediate upside follow through is very much in question despite what’s shown above. But if I see more bullish evidence emerge over the next few days this study could provide a nice start in building a bullish outlook.

Friday, December 10, 2010

SPY Consecutive 50-day Highs On Lower Volume

Declining volume at new highs can often lead to short-term difficulties.  Below is a study related to SPY and SPY volume that I've shown a few times in the Subscriber Letter.  It popped up in the Quantifinder again on Thursday.


This appears to suggest a mild downside edge.  The high probability of some kind of decline despite the fact that it always occurs in an intermediate-term uptrend makes the study compelling enough to me to take under consideration.

Thursday, August 5, 2010

Low Volume / High Price A Bearish Combination

While the SPX was closing at a new short-term high yesterday the NYSE volume was coming in at the lowest level in over two weeks according to my data. Over the last several years this has not been a good combination - even when the market is in an uptrend. This is demonstrated in the study below.


This would suggest the market may be susceptible to a pullback over the next few days.

Monday, June 14, 2010

Low Volume Rise To Short Term High In SPY

Below is one volume-related study that appeared in last night's Subscriber Letter.


Implications appear bearish. The bearish influence is primarily seen in the first 2 days. Of course we are looking at a sizable gap up this morning so it will be interesting to see how it plays out.

Tuesday, May 11, 2010

Strong Rally On Weak Volume For Nasdaq

Striking about Monday’s rally was the very low volume in the Nasdaq. It not only fell below the high levels achieved during Thursday and Friday’s wild trading, but it actually posted the lowest volume in over a week. This brought about a compelling study from the May 19,2009 blog post. I’ve updated that study below:

Monday, April 12, 2010

Some Early-Stage Volume Research

The Subscriber Letter has shown several studies lately that have suggested some of the low-volume rallies we are seeing will often lead to a pullback. It struck me that perhaps it might be worth looking at low-volume rallies in a slightly different way.

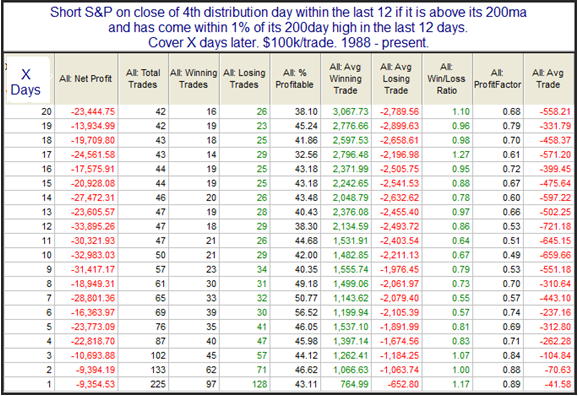
One tool that some analysts use is the concept of Distribution Days. Distribution days are basically days where the market sells off on relatively high volume. The theory is that when clusters of these days are seen near a market high it suggests an intermediate-term selloff is likely to ensue. Back in August I posted a study that examined this. It found the concept to be dead wrong. It is most often better to buy into these clusters of high-volume selloffs rather than looking for further selling.

Below I re-ran the results of that August study back to 1988 using the same parameters.


Recall that this study looks to go short, rather than buy. Therefore you are looking at a market that typically rose following such clusters.

Next, instead of looking for clusters of distribution days, I decided to substitute days that rose on volume that was lower than the pervious day’s volume. Here’s how those results came out.


It’s interesting to see here that results are mixed rather than suggestive of upside as the distribution day clusters were. This isn’t terribly surprising since many of the volume-related studies we see suggesting downside are due to low-volume rises rather than high-volume declines.

At this point the research is a bit half-baked, but I plan on expanding on this line of thought in the future.

Friday, March 12, 2010

Testing Common Knowledge About Volume On An SPX Breakout

In last night’s Subscriber Letter I looked at the breakout to a new closing high in the S&P 500. I defined a breakout to be a close at a 50-day high after having no closes at a 50-day high for at least 10 days. In general these breakouts showed positive momentum for about a week and then fizzled out. I broke down the breakouts a number of different ways. One way was by using volume. I wanted to test the common supposition that high volume was better when an index broke out. Those results were quite interesting and I’ve included them below. First instances like yesterday with lower NYSE volume.


Here we see a solid inclination for some upside follow through over the next week. But how does this compare to those times that the volume came in higher on the day of the breakout?


What was a decent edge over the first week is now essentially edgeless. Many times on this blog I’ve shown how common trading knowledge is often wrong. This serves as yet another example of why it is important to question common knowledge.

If you’d like to see more results related to my study of breakouts last night you may you may take a free 1-week trial of Quantifiable Edges by signing up here. If you’ve trialed in the past but not in a while, then you may email me at support @ quantifiable edges.com (no spaces).

Tuesday, February 2, 2010

How Does Monday's Low Volume Affect The Bounce Chances?

NYSE volume came in at the lowest level in over 2 weeks as the market rallied on Monday. Conventional wisdom suggests this low volume is a bad sign and it hurts the chances for a further bounce/rally. I’ve seen many comments in the last 24 hours stating the bounce cannot be trusted because of the low volume. So below is one test I ran examining this theory.


I compared these stats to days when volume was not at a 10-day low and they are quite a bit better here. From this standpoint it doesn’t seem the low volume is any kind of a warning sign. In fact it appears this setup provides a bullish edge. Perhaps very weak volume leaves just enough doubters that they end up chasing the market higher over the next several days as they become more convinced.

Tuesday, January 12, 2010

Declining SPY Volume At New Highs

Over the holidays it was easy to ignore the low volume and dismiss it as typical holiday traffic. Traders may have now returned but trading volume is still lacking. The low volume isn’t blatantly obvious because it’s still higher than it was during the holidays. Still, it’s definitely going in the wrong direction here. Below is a study I looked at last night using SPY.


The edge isn’t huge here but it does suggest a bit of downside is likely in the very near future. (And based on the futures the pullback could be starting this morning.)

Wednesday, October 21, 2009

The Last 4 Days Price/Volume Pattern

Price/volume the last 4 days has done the following. Thursday the SPX closed at a 50-day high on lower NYSE volume. Friday SPX closed lower and NYSE volume rose. Monday we got another 50-day closing high on lower NYSE volume. Tuesday another market drop with rising volume. That certainly sounds like a bearish price/volume pattern. I took a look.

Going back to 1970 I was only able to find two other instances with the same 4 day pattern where 50-day highs were being made. The 1st was 3/26/81 and it was followed by a decline of nearly a year and a half. The 2nd instance was 6/6/95 and that was followed by a 3-day consolidation and then a continuation of a massive bull market. Nothing to learn there.

But what if we look at the 4-day price/volume pattern on its own and not require new highs be made? Based on common knowledge it would still seem to be bearish. Below are stats going back to 1970:


It could be argued that the above results suggest bullish tendencies, especially over the 4-7 day period. I don’t see any evidence that suggests the current 4-day price/volume pattern is bearish.

Tuesday, September 29, 2009

Low Volume When The Market Rises Strongly

I showed yesterday how a very-low volume day during a decline can often lead to a short-term reversal. Today I will review a study that first appeared in the blog on 5/13/2008. It looks at extremely low volume on strong up days - like Monday. (Volume studies typically use the symbol $TVOL in Tradestation, which is their measure of NYSE volume. This is what is being used in the below study.)


We’ve seen several studies like this over time and many of them were identified by the Quantifinder on Monday. With so many studies confirming each other, it seems the downside edge in these very low volume rises is for real. One caveat with Monday’s action though is that it was Yom Kippur, meaning a lot of traders were out of action and somewhat lower volume could be expected. Still, it’s been a steady enough edge that I decided to it was worth review.

Monday, September 28, 2009

Friday's Very Low Volume Provides An Upside Edge

One hint from Friday that suggests a bounce is likely is the fact that volume came in very low. It was the lowest volume in over 2 weeks. Below are some tests which demonstrate the potential importance of this.

First, let’s look at 3 day pullbacks that don’t occur on extremely low volume.
(click table to enlarge)


As you can see there is a slight upside edge. The % winners were between 57% and 60% and the average gains days 1-3 were between 0.1% and 0.275%.

Now let’s look at times were the volume was extremely low:
(click table to enlarge)


Here the upside edge is significantly stronger over the next few days. The % winners were between 68% and 76% and the average gains days 1-3 were between 0.59% and 0.94%. The reliability of a bounce occurring at some point in the 3 day period increased from 75% to 87%.

Volume can often provide some valuable clues. For more volume-related analysis, you can check out the volume label on the right hand side of the blog.