Today I’m going to show the tendencies on an intraday basis. The break down will be similar to yesterday. The first chart shows results of buying any up bar and then exiting on any down bar. 15 minute bars are used for all the tests below.

A rising graph would show a propensity to follow through and a falling graph would show a propensity to reverse. A flat graph wouldn’t favor either. One note about all these graphs is that the day is closed out flat. There is no overnight holding since we are only measuring intraday tendencies. Throughout most of the 90’s, the easiest way to make money intraday was to find an uptrend an jump on it. As with daily bars, that seems to have changed over the last several years.
What about shorting down bars? How has that worked?

Similar to buying strength, shorting weakness worked well in the 90’s. Over the last few years it has struggled. Even with the difficult stock market performance this year, downmoves have shown a higher propensity to reverse than to continue. The May-June period was a notable exception.
Now for the combination. The rules are basically the same as yesterday buy on an up bar and then reverse and short on a down bar. Again – no overnight holding since intraday trends are the issue.

No surprise here –trending behavior was favored until around 2003 when the market shifted to a significantly more choppy environment. The most pronounced choppiness has occurred in the last year and a half, suggesting the last year and a half has rewarded intraday reversal trades and punished intraday trend trades more than any time in the last 15 years.

No surprise here –trending behavior was favored until around 2003 when the market shifted to a significantly more choppy environment. The most pronounced choppiness has occurred in the last year and a half, suggesting the last year and a half has rewarded intraday reversal trades and punished intraday trend trades more than any time in the last 15 years.
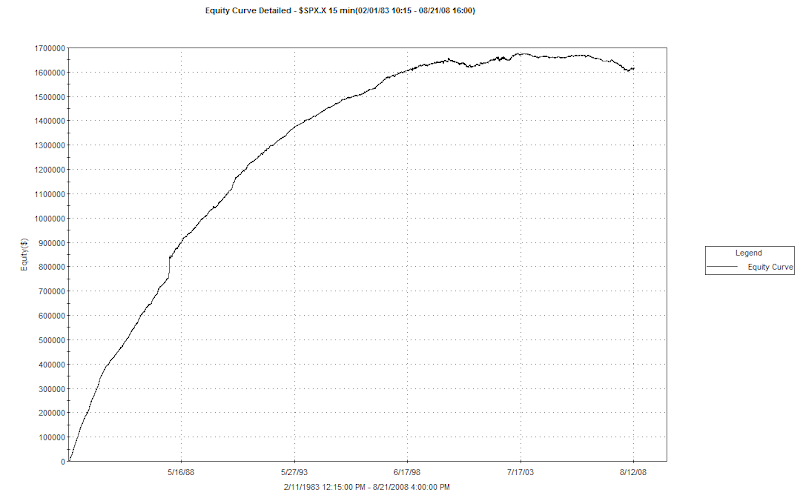
Now for the long-term look back. For this test I was able to run the data back a little over 25 years.
As was seen with the daily bars yesterday, the propensity to reverse rather than trend is a relatively new phenomenon. Intraday traders would do well to consider the consequences of these tendencies when developing intraday strategies.


7 comments:
Where was I during the halcion days of moving average cross overs?
How about a study on the weekly timeframe next?
Also, do you think the removal of the uptick rule has contributed to this new market choppiness?
I'd like to see the inverse of this study, shorting up bars and buying down bars. Great post!
Interesting that the edge seems to have faded so smoothly. It almost looks like you put a linear chart on a logarithmic scale.
Jeff - check the 100/180 ema cross. Boring but works like a f***ing charm. It's working right now.
Sell the rips, buy the dips. "Fast Money" mantra.
thx to the quant department ;-)
just love the way you are feeding your way back machine every day ...
Post a Comment