GLD – buy @ $84.00. GLD has dropped sharply over the last several days. I am looking to buy based on the following criteria: 1)It has closed below its 10-day moving average for at least 10 days. 2) It is above its 200-day moving average. 3) It made its lowest low of the recent selloff today. 4) It closed stretched further below its 10-day moving average than it has on any day of the recent selloff.
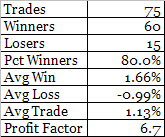
Buying the next day at the setup day’s closing price and selling when it closed above the 5-period moving average would have produced the following results over the last 10 years in the list of 109 heavily traded ETF’s I track (most of which have not been around for 10 years):

The setup has only occurred once before in GLD – on June 14th, 2006. It was sold 2 days later for a 3.15% gain.
The trade idea was entered at the open on 5/2/08 @ $83.96. It was closed at the next session’s close (5/5/08) for $86.27 – a 2.75% gain.
Due to feedback from subscribers, I have now begun providing the code for any such system trades to the subscriber base. Tradestation users may import it right into their software for further testing and design.
The 2nd recently added subscriber desired feature is intraday updates. When notable action is occurring in open trades, I may send out Intraday Updates to subscribers alerting them.
If you haven’t trialed the Quantifiable Edges Subscriber Letter yet, just drop a note to QuantEdges@HannaCapital.com and receive three free days. Simply include your name and email address.


7 comments:
Damian has left a new comment on your post "A Subscriber Letter Time Stretch System – And Some...":
Hmmm...interesting idea - but I get different trades on GLD. I get the trade on 5/2/08, but my trade in 2006 comes on 6/9/06 instead of 6/14/08. I don't use Tradestation - I use Amibroker and my code looks like this:
MAshort = MA(C,10);
MAdiff = MAshort - C;
MAlong = MA(C,200);
Buy = Sum(C (greater than) MAshort,10)==10 AND
C > MAlong AND L (less than) Ref(LLV(L,9),-1) AND MAdiff>Ref(HHV(MAdiff,9),-1);
Great than and less than used because Blogger doesn't allow HTML tags and those are interpreted as tags.
//Translation: the sum of days
//where the close is less than a
//10-day moving average is equal
//to 10, Close is greater than the
//200ma, the low is the lowest low
//of the past 10 days, and the
//difference between the close and
//the 10d ma is greater than the
//highest high of difference in
//the last 10 days.
//Sell when close is greater than
//5 day moving average.
Sell = C > MA(C,5);
Am I interpreting your rules correctly?
Any help greatly appreciated!
--------------------------
Damien,
I inadverantly deleted your comment and can't figure out how to restore it.
The reason you got 6/9 and I got 6/14 in my code I believe is a slight difference in the way it was written. The distance from the 10ma is the line that is different. You're saying it is the most stretched is has been in the last 10 days. I say it is the most stretched is has been since it began trading below the 10ma.
On 5/24/06 it was more stretched from the 10ma than on 6/9. Therefore 6/9 didn't qualify with my rules. I also used a percent stretch from the ma in my code, but that should make little difference.
Rob
Ok Rob - got it - I modified my code in the following way:
DaysBelow = BarsSince(C < MA(C,10));
//Count the number of days since
//the close was below a 10d MA
Buy = Sum(C (less than) MAshort,10)==10 AND C (greater than) MAlong AND L (less than) Ref(LLV(L,9),-1) AND
MAdiff (greater than) Ref(HHV(MAdiff,DaysBelow),-1);
//Translation: the sum of days
//where the close is less than a
//10-day moving average is equal
//to 10, Close is greater than the
//200ma, the low is the lowest low
//of the past 10 days, and the
//difference between the close and
//the 10d ma is greater than the
//highest high of difference since
//it crossed below the 10d ma.
Now - I get the right trades on GLD, but when I run the system on a diverse basket of ETFs (about 100), I get about a 50% win rate - much less than the 80% that you note. So a couple of questions:
- Is it the lowest low, or the lowest close?
- Are all calculations supposed to be "since the equity crossed under the 10d ma?"
Appreciate the help.
Also Rob - I get a different result for the first trade which may be the result of different data. I have the trade entering on 6/14 @ 56.65 (open) and closing on 6/16 @ 57.68 for a gain of 1.75%. Is this what you have?
Are you also taking only one position at a time?
Sorry for all the questions...
Hi!
I'm interested in where you get a trading idea like that. Is it by yourself or by getting ideas from trading forums?
Good work!
Damian,
1) It's the lowest low since the 10ma was crossed.
2) A limit order is used at the previous day's closing price. Therefore the 6/14 entry on GLD was at $55.92, not at the open price, which gapped up. Therefore, the theoretical rise was 3.15%.
Regards,
Rob
Johan,
I'm not a big forum guy. I devised this on my own.
As part of my routine I generally spend some time on "system" design each night. While I save my favorites, many I may just use for one trade.
Since the Subscriber Letter has come out I've probably designed 12-15 systems that have made their debut in the Letter.
Regards,
Rob
Post a Comment