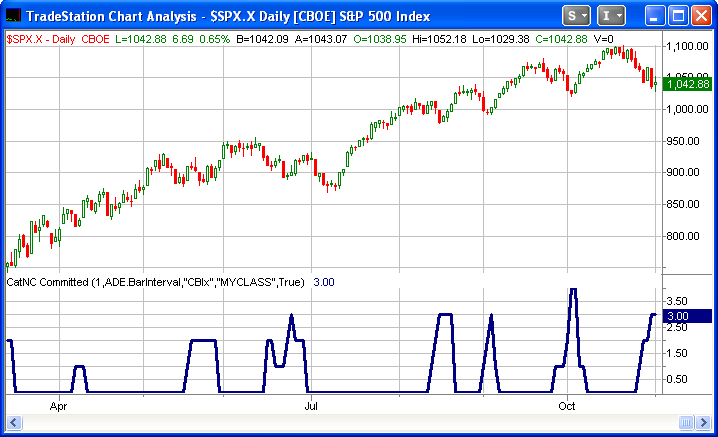
As long-time readers may recall, I don’t normally view CBI readings below 5 as any kind of warning sign. It’s not until readings reach 10 or more that they become highly indicative of an upcoming oversold bounce. We haven’t seen a reading above 4 in almost 8 months now. Even the current selloff has only seen the number move up to 3. It also appears unlikely to move substantially higher in the very near term. While other breadth readings like the McClellan Oscillator have been reaching extreme levels, the CBI requires more intense selling among individual issues – not just a broad decline. I’ll discuss the CBI again when more significant readings arrive.
For those who would like to learn more about this inidicator, you may check out the CBI label on the right hand side of the page.


No comments:
Post a Comment