Monday, February 6, 2012

The QE Buying Power Index for Swing Trading Short

On Friday I introduced the QE Buying Power Index and showed results over the 2008-2011 period when looking to buy pullbacks with a strong QE Buying Power Index reading versus a weak one. Today I’ll show the other side of the coin. Below is a short-side version of the same swing trade system. On Friday the system I used to demonstrate the importance of buying power simply bought the SPX when it closed in the bottom 20% of the 10-day range and then sold it when it closed back in the top half. Today we’ll look at shorting closes in the top 20% of the range and covering in the bottom half.

First let’s look at times when the QE Buying Power Index was positive.


As you can see, when the QE Buying Power Index has been positive, trying to short overbought market readings has been futile and there has been no edge in doing so.

But now let’s examine results when the QE Buying Power Index was NOT positive.


We see here a remarkable difference. Simply taking buying power into consideration changes the results dramatically.

Over the last 4 years buying power has been extremely important in determining market movements. In the special (100% satisfaction guaranteed) webinars later this week I will explain to traders the concept behind the QE Buying Power Index and teach them how to calculate it. I’ll discuss how the it has influenced the intermediate-term over the years and how you can use it to swing trade with a system like those I’ve discussed the last few blog posts.

Click here for more information on the webinars and to register.

Friday, February 3, 2012

QE Buying Power Index & Swing Trading System

A market variable that I rarely see discussed and almost never utilized is Buying Power. And while it has become easily measurable and quantifiable over the last several years, I have found very little information on the concept. In some special webinars next week I will unveil the new QE Buying Power Index. The QE Buying Power Index can be used to help determine whether a reversal or a continuation of a move is likely. Below is a simple swing trading system that demonstrates the value of the QE Buying Power Index.

To see its impact on performance let’s examine a simple swing trading system that looks to buy pullbacks. The pullback approach is very simple. The swing system buys SPX whenever it closes in the bottom 20% of its 10-day range and holds it until it closes in the top half of its (then current) 10-day range. In the performance report below you can see how SPX performed from 2008 – 2011 when pullbacks were bought and the QE Buying Power Index reading was low.


While there were a few more winners, the size of the losers was much higher. Buying pullbacks in this way would have produced more frustration than profits. It was essentially a breakeven strategy over the 4-year period.

But now let’s look at results when the QE Buying Power Index was providing strong readings.


The numbers here are outstanding. With strong buying power present pullbacks provided high probability opportunities. Let’s take a quick look at a profit curve to see how the steady the gains were.


Profit curves don’t get much more appealing than that.

So what is the secret, and how can you compute the QE Buying Power Index yourself? Register for one of the webinars and find out! The cost is only $25.00, and while performance is never guaranteed, your satisfaction with the information presented is – 100%. For more information and to register for an upcoming webinar click here.

A Long-Term Look At Employment Days

Employment days have an interesting history and they have contributed to some worthwhile studies over the years. Below is a chart of SPY performance on Employment Days. For this equity curve I filtered to only include days where SPY was > its 200ma. Each trade was a fictional $100k.


What I find so interesting about the chart is that for a long time Employment Days in uptrends showed a strong propensity for gains. But in 2000 this edge vanished. Since then there has been no apparent advantage – bullish or bearish.

Wednesday, February 1, 2012

Strong Breadth & a Down SPX

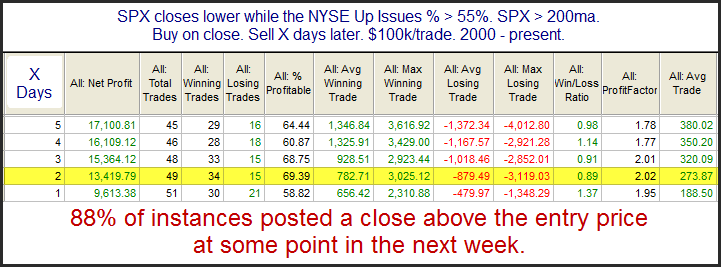
When breadth posts solid numbers and the SPX declines (during an uptrend) that has often been followed by a rebound in the next few days. The study below triggered at Tuesday’s close. It is one I have shown several times in the Subscriber Letter.


The edge isn’t huge, but it does appear to be fairly reliable. Much of the edge is realized within the 1st 2 days.

Tuesday, January 31, 2012

The Odds That Turnaround Tuesday Lives Up To Its' Name...

I’ve shown before that of all days Tuesday has historically shown the highest propensity to halt a short-term pullback. The study below is one from the larger Turnaround Tuesday study. All stats are updated..


As you can see the market has strongly favored a quick move higher. And when that move hasn’t happened on Tuesday it has often happened in the next few days.

Wednesday, January 25, 2012

When SPX Closes Just Under a 50-day High Prior to a Fed Day

Yesterday I showed that Fed Days typically carry a bullish edge, but that edge failed to hold when the SPX closed at a 20-day high just prior to the Fed Day. By closing down 0.1% Tuesday the SPX narrowly missed closing at a 20-day high. So are we now safe because the market just missed a new high by 0.1% on Tuesday? Last night I suspected not. And so I ran the below test. Since we are near a 50-day high I used that as the filter rather than a 20-day high. I looked at times where the SPX did NOT close at a 50-day high, but in fact closed less than 0.5% below it. So although it is not a new high, the environment still appears positive. Let’s look at the results.


Twenty-five instances and the result is nearly dead-even. This is very similar to what we saw with yesterday’s study. I’m not viewing today as a typical strongly-bullish Fed Day.

Tuesday, January 24, 2012

Intermediate-Term Highs Prior to Fed Days

Wednesday is a Fed Day.  As I have discussed many times, Fed Days generally carry an upside tendency.  But this tendency is greatly impacted by certain variables.  A large collection of these variables may be found here on the blog under the “Fed Day”label.  And many more may be found in the “Quantifiable Edges Guide to Fed Days”.

One variable I briefly discussed in the 11/3/10 blog was whether the market was already at an intermediate-term high.  Today I thought I would illustrate that study graphically.

First, let’s take an updated look at SPX performance on Fed Days when the SPX has NOT closed at a 20-day high the day before.


That’s basically 30 years of bullishness.

But now let’s see performance at times when the SPX did close at a 20-day high the day before.


No consistency and no pronounced edge in this sample of 36 instances.

Traders looking to play for a short-term Fed Day bump should be hoping the SPX does not close up and at a new high again today.